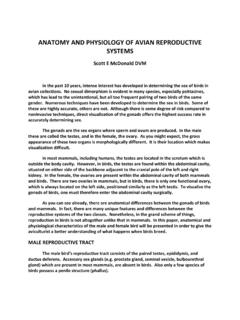
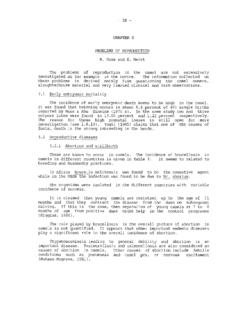
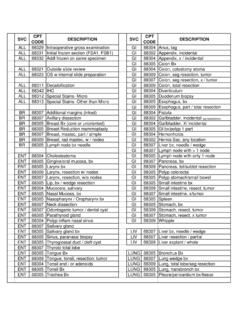
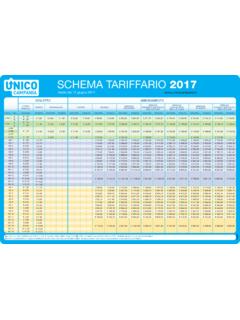
Transcription of Figure I. Comparing Countries’ and eConomies’ …
1 What Students Know and Can Do: Student Performance in Reading, Mathematics and Science Figure I.. Comparing countries' and Economies' performance Statistically significantly above the OECD average Not statistically significantly different from the OECD average Statistically significantly below the OECD average On the reading subscales On the On the overall Access Integrate Reflect Continuous Non-continuous mathematics On the science reading scale and retrieve and interpret and evaluate texts texts scale scale OECD average 493 495 493 494 494 493 496 501. Shanghai-China 556 549 558 557 564 539 600 575. Korea 539 542 541 542 538 542 546 538. Finland 536 532 538 536 535 535 541 554. Hong Kong-China 533 530 530 540 538 522 555 549. Singapore 526 526 525 529 522 539 562 542. Canada 524 517 522 535 524 527 527 529. New Zealand 521 521 517 531 518 532 519 532. Japan 520 530 520 521 520 518 529 539. Australia 515 513 513 523 513 524 514 527. Netherlands 508 519 504 510 506 514 526 522.
2 Belgium 506 513 504 505 504 511 515 507. Norway 503 512 502 505 505 498 498 500. Estonia 501 503 500 503 497 512 512 528. Switzerland 501 505 502 497 498 505 534 517. Poland 500 500 503 498 502 496 495 508. Iceland 500 507 503 496 501 499 507 496. United States 500 492 495 512 500 503 487 502. Liechtenstein 499 508 498 498 495 506 536 520. Sweden 497 505 494 502 499 498 494 495. Germany 497 501 501 491 496 497 513 520. Ireland 496 498 494 502 497 496 487 508. France 496 492 497 495 492 498 497 498. Chinese Taipei 495 496 499 493 496 500 543 520. Denmark 495 502 492 493 496 493 503 499. United Kingdom 494 491 491 503 492 506 492 514. Hungary 494 501 496 489 497 487 490 503. Portugal 489 488 487 496 492 488 487 493. Macao-China 487 493 488 481 488 481 525 511. Italy 486 482 490 482 489 476 483 489. Latvia 484 476 484 492 484 487 482 494. Slovenia 483 489 489 470 484 476 501 512. Greece 483 468 484 489 487 472 466 470. Spain 481 480 481 483 484 473 483 488.
3 Czech Republic 478 479 488 462 479 474 493 500. Slovak Republic 477 491 481 466 479 471 497 490. Croatia 476 492 472 471 478 472 460 486. Israel 474 463 473 483 477 467 447 455. Luxembourg 472 471 475 471 471 472 489 484. Austria 470 477 471 463 470 472 496 494. Lithuania 468 476 469 463 470 462 477 491. Turkey 464 467 459 473 466 461 445 454. Dubai (UAE) 459 458 457 466 461 460 453 466. Russian Federation 459 469 467 441 461 452 468 478. Chile 449 444 452 452 453 444 421 447. Serbia 442 449 445 430 444 438 442 443. Bulgaria 429 430 436 417 433 421 428 439. Uruguay 426 424 423 436 429 421 427 427. Mexico 425 433 418 432 426 424 419 416. Romania 424 423 425 426 423 424 427 428. Thailand 421 431 416 420 423 423 419 425. Trinidad and Tobago 416 413 419 413 418 417 414 410. Colombia 413 404 411 422 415 409 381 402. Brazil 412 407 406 424 414 408 386 405. Montenegro 408 408 420 383 411 398 403 401. Jordan 405 394 410 407 417 387 387 415. Tunisia 404 393 393 427 408 393 371 401.
4 Indonesia 402 399 397 409 405 399 371 383. Argentina 398 394 398 402 400 391 388 401. Kazakhstan 390 397 397 373 399 371 405 400. Albania 385 380 393 376 392 366 377 391. Qatar 372 354 379 376 375 361 368 379. Panama 371 363 372 377 373 359 360 376. Peru 370 364 371 368 374 356 365 369. Azerbaijan 362 361 373 335 362 351 431 373. Kyrgyzstan 314 299 327 300 319 293 331 330. Source: OECD, PISA 2009 Database. 12 8 OECD 2010 PISA 2009 Results: Executive Summary