Transcription of Financial Indicators of Steady Success in Manufacturing ...
1 Advances in Management & Applied Economics, vol. 3, , 2013, 217-234. ISSN: 1792-7544 (print version), 1792-7552(online). Scienpress Ltd, 2013. Financial Indicators of Steady Success in Manufacturing Companies: Research on Big Manufacturing Companies in Turkey Cengiz Erdamar1, Burcu Adilo lu2 and Tu ba G rsoy3. Abstract Financial Indicators (ratios) are calculated from the data found in basic Financial statements. Balance sheets, income statements and cash flow statements are used in making different analyses for different information users. These Indicators can be used to make inferences about a company's Financial condition and its operations and attractiveness as an investment. They also can be used to analyze trends and compare companies' Financial performance and situation to other firms. This study empirically examines the common and distinctive Financial Indicators of Steady and unsteady successful big Manufacturing companies in Turkey by using data mining methodology.
2 In this framework, the variables that affect the Success of the company are identified by using logistic regression analysis. Then the differential values of the Indicators are identified by using decision trees. Decision tree analysis is used for checking the logistic regression analysis results. As a result of different tries, the most appropriate decision tree algorithm, C&RT (Classification and Regression Trees) has been selected. According to logistic regression analysis, current ratio, quick ratio, debt ratio, short term debt/total debts, inventory turnover ratio, CFFO/total assets and CFFF/CFFI variables are found to be significant at the 95% confidence level. The results also reveal that quick ratio, debt ratio, short term debt/total debts and inventory turnover ratio variables are found to be distinctive Financial Indicators for successful companies by using decision trees.
3 JEL classification number: M41. Keywords: Financial ratios, Data mining, Decision trees, Successful companies, Turkey 1. Istanbul University School of Business, Accounting Department. 2. Istanbul University School of Business, Accounting Department. Corresponding author. 3. Istanbul University School of Business, Quantative Methods Department. Article Info: Received : April 12, 2013. Revised : May 9, 2013. Published online : July 1, 2013. 218 Cengiz Erdamar, Burcu Adilo lu and Tu ba G rsoy 1 Introduction General purpose Financial statements are intended to meet the needs of users who are not in a position to require an entity to prepare reports tailored to their particular information needs. (IAS 1) To fulfill this task, accounting departments have assumed the function of preparation and interpretation of Financial statements. The objective of Financial statements is to provide information in a structured representation about the Financial position, Financial performance and cash flows of an entity that is useful to a wide range of users in making economic decisions.
4 Financial statements also show the results of the management's stewardship of the resources entrusted to it [1]. Financial ratio analysis is the calculation and comparison of ratios that are derived from the information in a company's Financial statements. These ratios can be used to make inferences about a company's Financial condition, its operations and attractiveness as an investment. Financial ratios can be also used to analyze trends and compare companies'. Financial performance and situation to other firms. A Financial analysis assists in identifying the major strengths and weaknesses of a business enterprise. It indicates whether a firm has enough cash to meet obligations, a reasonable accounts receivable collection period, an efficient inventory policy management policy, sufficient plant, property, and equipment and an adequate capital structure. All of them are necessary if the firm is to achieve the goal of maximizing shareholder wealth.
5 Financial analysis can be also used to assess a firm's viability as an ongoing enterprise and determine whether a satisfactory return is being earned for the risks taken [2]. The basic expectation of all stakeholders is a Steady successful company. With the results of this study, stakeholders can observe the Financial structure of these companies and can identify their policies and make decisions. This study empirically examines the common and distinctive Financial Indicators of Steady and unsteady successful big Manufacturing companies in Turkey by using data mining methodology. Several studies have been and are still being realized in the area of Financial ratios and data mining separately. However, there was no study found in the existing literature that combines these two areas together. This will be the first study in Turkey about Financial ratios using data mining. Therefore, the study is expected to contribute to the literature on accounting ratios and data mining.
6 This remainder of this study is organized in three sections. In Section 2, the data set, variables employed, research design and methodology are discussed. The empirical findings are presented in Section 3, and Section 4 offers the study conclusions. 2 Data Set and Methodology To examine the common and distinctive Financial Indicators of Steady and unsteady successful big Manufacturing companies in Turkey, this section explains the sample size, data set and variables employed, research design and methodology of the study. Financial Indicators of Steady Success in Manufacturing Companies in Turkey 219. Sample Size The sample consists of 174 Manufacturing firms that are listed both in the Istanbul Stock Exchange (ISE) and the Istanbul Chamber of Industry (ICI) top 1,000 companies over the past 10 years. The scope of this study is restricted in this way because one of the key Success Indicators of a company is size (top 1000 companies) and the ability to access the Financial data (listed in ISE).
7 The ICI top 1,000 companies were first selected for the sample. Then it was observed that there were companies in the ICI second top 500 companies section that are listed in the ISE. As a result, the sample consists only of the ICI top 500 companies that are listed in ISE. The Financial statements for 2001 to 2009 were collected from the Istanbul Stock Exchange web site. While collecting the data, the companies were divided into 2. categories as Steady successful and unsteady successful companies. In this study, the Steady successful companies were defined as those that were listed in the ICI top 500. companies list for 10 years continuously (from 2001 to 2009). Unsteady successful companies were defined as the companies that were listed in the ICI top 500 companies list temporarily. Financial statements of 174 companies, 86 Steady successful and 88. unsteady successful companies, were gathered as of December 31 for 2001 to 2009.
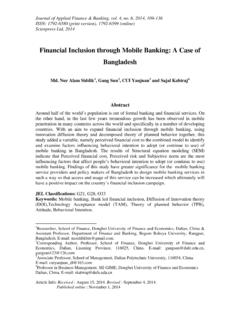
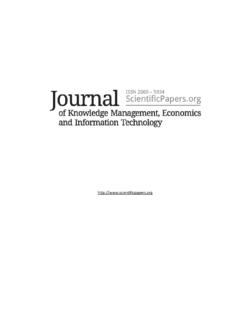
8 The distribution of these categories is shown in Table 1. The distribution of industries for these companies are shown in Figures 1, 2 and 3. Table 1: Number of successful companies Number Percentage Steady Successful Companies, coded as 1 86 49%. Unsteady Successful Companies, coded as 0 88 52%. Total 174 100%. These types of companies were excluded from the study;. Non- Manufacturing companies ( Financial institutions are excluded because their Financial statements and Financial ratios have different aspects). Companies that were not listed in the ICI top 100 companies in the past 10 years. Companies that were listed in the ICI top 100 companies but not listed in the Istanbul Stock Exchange in the past 10 years. Also, non- Financial ratios that affected the Success of the companies were excluded from the study. 220 Cengiz Erdamar, Burcu Adilo lu and Tu ba G rsoy Steady SUCCESSFUL FOOD, TECHNOLOGY BEVERAGE, METAL TOBACCO.
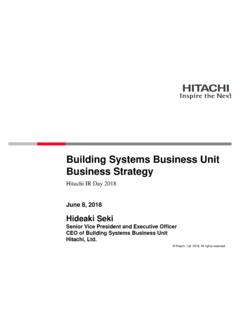
9 PRODUCTS, ELECTRICITY 4%. 10%. MACHINERY AND 1%. EQUIPMENT TEXTILE, LEATHER. 16% 10%. WOOD, PAPER, PRINTING. BASIC METAL. 7%. 9%. CHEMICAL, PETROLEUM, NON-METALLIC PLASTIC. MINERAL 18%. 25%. Figure 1: Percentage of Steady successful companies by sector UNSTEADY SUCCESSFUL. TECHNOLOGY. ELECTRICITY 6%. 4%. METAL FOOD, PRODUCTS, BEVERAGE, MACHINERY AND TOBACCO. EQUIPMENT 15%. 13%. TEXTILE, LEATHER. BASIC METAL. 17%. 9%. WOOD, PAPER, NON-METALLIC. PRINTING. MINERAL. CHEMICAL, 15%. 4%. PETROLEUM, PLASTIC. 17%. Figure 2: Percentage of unsteady successful companies by sector Financial Indicators of Steady Success in Manufacturing Companies in Turkey 221. TECHNOLOGY FOOD, 5% TOTAL BEVERAGE, TOBACCO. ELECTRICITY 12%. METAL 3%. PRODUCTS, MACHINERY AND. EQUIPMENT. 14%. TEXTILE, LEATHER. 13%. BASIC METAL. 8%. WOOD, PAPER, NON-METALLIC CHEMICAL, PRINTING. MINERAL PETROLEUM, 10%. 17% PLASTIC.
10 18%. Figure 3: Percentage of successful companies by sector Data Set After collecting the data, thirty one Financial Indicators (ratios, variables of the study) that are suggested to be important were selected to conduct the empirical research after a detailed literature review. In the literature, there are approximately 70 Financial Indicators described to define the Financial structure, liquidity, profitability, debt payment capability and the value of the companies. These Financial Indicators are calculated from the data in the basic Financial statements. Balance sheets, income statements and cash flow statements were used in making different analyses for different information users. Data collected for 31 variables that were determined to be important and were used for analyses are displayed in Table 2. Table 2: Definitions of variables Name of the Financial ratio Calculation method Current ratio Current assets/Current liabilities Quick ratio (Current assets- inventory)/Current liabilities Coverage period ((Short term debt-Cash and cash equivalents)/CFFO)*360.