Transcription of Financial integration in Europe - European Central Bank
1 Financial integration in Europe May 2017. Contents Preface 2. Key messages 3. Overall assessment of Financial integration 3. Selected policy issues for Financial integration 4. Overview of the report 7. Chapter 1: Recent developments in Financial integration in the euro area 8. 1 General developments 9. 2 Market-specific developments 12. Box 1 Financial integration indicators based on enhanced euro area accounts' who-to-whom data 23. Chapter 2: Eurosystem activities for Financial integration 25. 1 Banking union 26. 2 Capital markets union 33. Special feature: Cross-border bank consolidation in the euro area 41. 1 Mergers and acquisitions and the structure of the euro area banking system 42. 2 Cross-border bank M&As in the euro area: A cost-benefit perspective 47. Box A Assessing the relationship between cross-border M&As and banks' stability, efficiency and business strategy in the euro area 54.
2 3 Obstacles to cross-border bank consolidation in the euro area 60. Statistical annex: Financial integration indicators 2017 65. 1 Composite indicators of Financial integration in Europe 65. 2 Indicator of risk sharing 70. 3 Explanation of the country groupings 71. 4 Standard indicators 72. Abbreviations 102. Financial integration in Europe , May 2017 Contents 1. Preface The ECB's annual report on Financial integration in Europe contributes to the advancement of the process of European Financial integration by analysing its development and the related policies. For the ECB, the market for a given set of Financial instruments and/or services is fully integrated if all potential market participants with the same relevant characteristics: (1) face a single set of rules when they decide to deal with those Financial instruments and/or services; (2) have equal access to those Financial instruments and/or services; and (3) are treated equally when they are active in the market.
3 1. The Eurosystem has a keen interest in the integration and efficient functioning of the Financial system in Europe , especially in the euro area, as reflected in the Eurosystem's mission statement. Financial integration fosters the smooth and balanced transmission of monetary policy throughout the euro area. In addition, it is relevant for Financial stability and is among the reasons behind the Eurosystem's task of promoting well-functioning payment systems. Without prejudice to the objective of maintaining price stability, the Eurosystem also supports the objective of completing the EU Single Market, of which Financial integration is a key aspect. In September 2005 the ECB published a first set of indicators of Financial integration and an accompanying report assessing the state of Financial integration in the euro area. Since then, this work on Financial integration has evolved and has led to the publication of a yearly report.
4 This year the ECB is introducing two changes to the report. First, it will now alternate biennially between a full and a more concise version. This approach has been chosen in view of the fact that Financial integration tends to be a slow-moving process; a full report is not therefore required every year. The more concise version will consist of shorter chapters on the main Financial integration developments and the Eurosystem's activities relating to Financial integration , while still including an in- depth discussion of a selected topic in a special feature. The bi-annual release of Financial integration indicators on the ECB's website will not be affected by this change. The second change is that the report will now include a regular analysis of the quality of Financial integration , the economic benefits it delivers and its resilience. This extension of perspective is based on the Special feature Financial integration and risk sharing in a monetary union in the 2016 report and will involve the inclusion of indicators of cross-country risk sharing.
5 1. Baele, L. et al., Measuring Financial integration in the euro area , Occasional Paper Series, No 14, ECB, April 2004. Financial integration in Europe , May 2017 Preface 2. Key messages Overall assessment of Financial integration Overall Financial integration within the euro area has shown mixed developments since last year's report. While money market integration remained at broadly stable levels in 2016, the various indicators for euro area banking, bond and equity markets showed diverse tendencies. These diverging signals were related to the counterbalancing effects that shaped Financial market conditions in 2016. The effects, in turn, were partly due to changing market expectations concerning future economic fundamentals and, as a consequence, the resulting asset price convergence or divergence cannot be unambiguously linked to changes in Financial integration . Overall, after the deceleration of the previous Financial reintegration trend described in last year's report, the ECB's price-based composite indicator of Financial integration appeared volatile in 2016, and the quantity-based composite indicator flattened out.
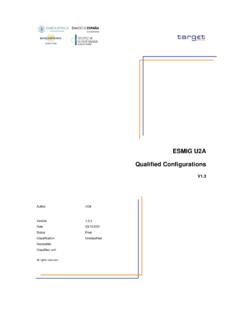
6 Both signal no progress in aggregate Financial integration across euro area countries over the observation period (Chart A). Chart A. Price-based and quantity-based Financial integration composite indicators quantity-based Financial integration composite indicator price-based Financial integration composite indicator Q1/95 Q1/98 Q1/01 Q1/04 Q1/07 Q1/10 Q1/13 Q1/16 Q1/14 Q1/15 Q1/16. Sources: ECB and ECB calculations. Notes: The price-based composite indicator aggregates ten indicators covering the period from the first quarter of 1995 to the fourth quarter of 2016, and the quantity-based composite indicator aggregates five indicators available from the first quarter of 1999 to the third quarter of 2016. The composite indicators are bounded between zero (full fragmentation) and one (full integration ). Increases in the composite indicators signal higher Financial integration .
7 For a detailed description of the indicators and the input data, see the Statistical annex. The halt in measured aggregate Financial integration warrants careful monitoring and an assessment of the economic benefits of current integration levels, and underlines the importance of ongoing policy initiatives regarding the capital markets union (CMU) and the completion of the banking union. It should be borne in mind that part of the higher levels of the two Financial integration composite indicators in the years directly preceding the Financial and sovereign debt crises, as shown in Chart A, was Financial integration in Europe , May 2017 Key messages 3. linked to the fact that cross-country risk differentials were insufficiently reflected in Financial markets. This is one of the reasons why this year's report has now started to complement quantitative measurement by including assessments of the quality of Financial integration , with the aim of capturing its economic benefits.
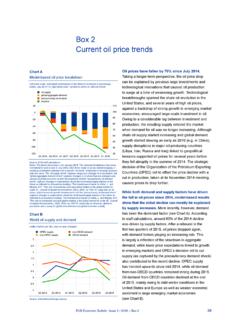
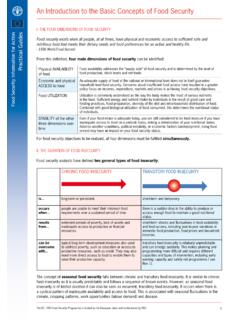
8 To this effect, two measures of cross-country risk sharing are added and will be monitored regularly. The most recent estimates suggest that risk sharing remains low in the euro area and that limited private Financial risk sharing plays a significant role in this, as can be seen in Chart B below. The large light blue parts of the bars indicate that a large share of income shocks in euro area countries are reflected in their consumption, whereas the small dark blue and yellow parts indicate that cross-border equity holdings or credit do not contribute greatly to smoothing consumption. Chart B. Consumption risk sharing in the euro area and its channels (percentages). capital channel price channel credit channel unsmoothed fiscal channel 150. 125. 100. 75. 50. 25. 0. -25. -50. 2001 2002 2003 2004 2005 2006 2007 2008 2009 2010 2011 2012 2013 2014 2015 2016. Source: ECB calculations.
9 Notes: The chart displays, by year, the contribution of capital markets (via cross-border ownership of productive assets), credit markets (via cross-border borrowing and lending), fiscal tools (via public cross-border transfers), and relative prices (via changes in the domestic consumer price index relative to the euro area average index) to the smoothing of country-specific shocks to real GDP. growth. The respective contributions are calculated using a vector-autoregression (VAR) model whose parameters are estimated over a ten-year rolling window of annual data, applying the approach given by Asdrubali, P. and Kim, S., Dynamic risksharing in the United States and Europe , Journal of Monetary Economics, Vol. 51, 2004, pp. 809-836, enhanced for relative price adjustments (see Chapter 1 for more details). The bars display the share of a one-standard-deviation shock to domestic GDP growth that is absorbed by each respective risk sharing channel.
10 The shares are computed on the basis of the cumulative impact of the shock on the variables capturing each risk sharing channel over a five-year horizon. Year-to-year variation in the shares reflects changes in the re-estimated model parameters. The remaining portion represents the portion of the shock to country-specific real GDP growth that remains unsmoothed and is fully reflected in country-specific consumption growth. The individual bars can go below 0% and above 100% if one or more of the channels involved has a dis-smoothing effect on country-specific consumption growth. All bars together total 100%. Ireland is currently excluded from the calculation of the indicator owing to unusually large revisions in some of the country's main macroeconomic statistics for 2015 that were made in July 2016. These revisions affected real GDP, some of its components and balance-of-payments figures; some of them would feed into the indicator in this chart although they would not indicate a change in risk sharing.