Transcription of Financial Ratio Analysis
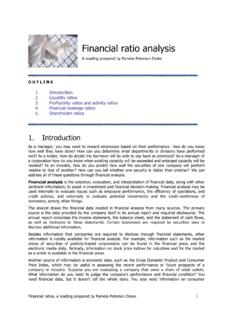
1 Financial Ratio Analysis A reading prepared by Pamela Peterson Drake O U T L I N E 1. Introduction 2. Liquidity ratios 3. Profitability ratios and activity ratios 4. Financial leverage ratios 5. Shareholder ratios 1. Introduction As a manager, you may want to reward employees based on their performance. How do you know how well they have done? How can you determine what departments or divisions have performed well? As a lender, how do decide the borrower will be able to pay back as promised? As a manager of a corporation how do you know when existing capacity will be exceeded and enlarged capacity will be needed?
2 As an investor, how do you predict how well the securities of one company will perform relative to that of another? How can you tell whether one security is riskier than another? We can address all of these questions through Financial Analysis . Financial Analysis is the selection, evaluation, and interpretation of Financial data, along with other pertinent information, to assist in investment and Financial decision-making. Financial Analysis may be used internally to evaluate issues such as employee performance, the efficiency of operations, and credit policies, and externally to evaluate potential investments and the credit-worthiness of borrowers, among other things.
3 The analyst draws the Financial data needed in Financial Analysis from many sources. The primary source is the data provided by the company itself in its annual report and required disclosures. The annual report comprises the income statement, the balance sheet, and the statement of cash flows, as well as footnotes to these statements. Certain businesses are required by securities laws to disclose additional information. Besides information that companies are required to disclose through Financial statements, other information is readily available for Financial Analysis .
4 For example, information such as the market prices of securities of publicly-traded corporations can be found in the Financial press and the electronic media daily. Similarly, information on stock price indices for industries and for the market as a whole is available in the Financial press. Another source of information is economic data, such as the Gross Domestic Product and Consumer Price Index, which may be useful in assessing the recent performance or future prospects of a company or industry. Suppose you are evaluating a company that owns a chain of retail outlets.
5 What information do you need to judge the company's performance and Financial condition? You need Financial data, but it doesn't tell the whole story. You also need information on consumer Financial ratios, a reading prepared by Pamela Peterson Drake 1 spending, producer prices, consumer prices, and the competition. This is economic data that is readily available from government and private sources. Besides Financial statement data, market data, and economic data, in Financial Analysis you also need to examine events that may help explain the company's present condition and may have a bearing on its future prospects.
6 For example, did the company recently incur some extraordinary losses? Is the company developing a new product? Or acquiring another company? Is the company regulated? Current events can provide information that may be incorporated in Financial Analysis . The Financial analyst must select the pertinent information, analyze it, and interpret the Analysis , enabling judgments on the current and future Financial condition and operating performance of the company. In this reading, we introduce you to Financial ratios -- the tool of Financial Analysis .
7 In Financial Ratio Analysis we select the relevant information -- primarily the Financial statement data -- and evaluate it. We show how to incorporate market data and economic data in the Analysis and interpretation of Financial ratios. And we show how to interpret Financial Ratio Analysis , warning you of the pitfalls that occur when it's not used properly. We use Microsoft Corporation's 2004 Financial statements for illustration purposes throughout this reading. You can obtain the 2004 and any other year's statements directly from Microsoft.
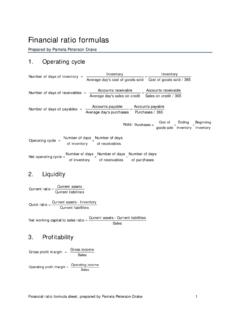
8 Be sure to save these statements for future reference. Classification of ratios A Ratio is a mathematical relation between one quantity and another. Suppose you have 200 apples and 100 oranges. The Ratio of apples to oranges is 200 / 100, which we can more conveniently express as 2:1 or 2. A Financial Ratio is a comparison between one bit of Financial information and another. Consider the Ratio of current assets to current liabilities, which we refer to as the current Ratio . This Ratio is a comparison between assets that can be readily turned into cash -- current assets -- and the obligations that are due in the near future -- current liabilities.
9 A current Ratio of 2:1 or 2 means that we have twice as much in current assets as we need to satisfy obligations due in the near future. Ratios can be classified according to the way they are constructed and their general characteristics. By construction, ratios can be classified as a coverage Ratio , a return Ratio , a turnover Ratio , or a component percentage: 1. A coverage Ratio is a measure of a company's ability to satisfy (meet) particular obligations. 2. A return Ratio is a measure of the net benefit, relative to the resources expended.
10 3. A turnover Ratio is a measure of the gross benefit, relative to the resources expended. 4. A component percentage is the Ratio of a component of an item to the item. When we assess a company's operating performance, we want to know if it is applying its assets in an efficient and profitable manner. When we assess a company's Financial condition, we want to know if it is able to meet its Financial obligations. There are six aspects of operating performance and Financial condition we can evaluate from Financial ratios: 1. A liquidity Ratio provides information on a company's ability to meet its short term, immediate obligations.