Transcription of Financial Statements 2015 - Nestlé
1 FinancialStatements 2015 Consolidated Financial Statements of the nestl Group 2015149th Financial Statementsof nestl the nestl Group 2015 Consolidated Financial Statements of the nestl Group 2015585960616264656767707482838485889310 2104106118121123124127130132133134 Principal exchange ratesConsolidated income statement forthe year ended 31 December 2015 Consolidated statement of comprehensive income for the year ended 31 December 2015 Consolidated balance sheet as at31 December 2015 Consolidated cash fl ow statement for the year ended 31 December 2015 Consolidated statement of changes in equity for the year ended 31 December 2015 Notes1. Accounting policies2. Scope of consolidation, acquisitions and disposals of businesses, assets held for sale3.
2 Analyses by segment4. Net other trading and operating income/ (expenses)5. Net fi nancial income/(expense)6. Inventories7. Trade and other receivables8. Property, plant and equipment9. Goodwill and intangible assets10. Employee benefi ts11. Equity compensation plans12. Provisions and contingencies13. Financial instruments14. Taxes15. Associates and joint ventures16. Earnings per share17. Cash fl ow statement18. Equity19. Lease commitments20. Transactions with related parties21. Guarantees22. Group exposure in Venezuela23. Events after the balance sheet dateReport of the Statutory Auditor on the Consolidated Financial StatementsFinancial information 5 year reviewCompanies of the nestl Group.
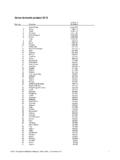
3 Joint arrangements and associates136138140 Consolidated Financial Statements of the nestl Group 201559 Principal exchange ratesCHF per2015 2014 2015 2014 Year ending ratesWeighted average annual rates1 US Euro Chinese Yuan Brazilian Pound Mexican Philippine Canadian Russian Australian Japanese Financial Statements of the nestl Group 201560 Consolidated income statementfor the year ended 31 December 2015In millions of CHFN otes20152014 Sales388 785 91 612 Other revenue 298 253 Cost of goods sold(44 730)(47 553)Distribution expenses(7 899)(8 217)Marketing and administration expenses(20 744)(19 651)Research and development costs (1 678)(1 628)Other trading income4 78 110 Other trading expenses4(728)(907)Trading operating profi t313 382 14 019 Other operating income4 126 154 Other operating expenses4(1 100)(3 268)Operating profi t12 408 10 905 Financial income5 101 135 Financial expense5(725)(772)Profi t before taxes, associates and joint ventures11 784 10 268 Taxes14(3 305)(3 367)Income from associates and joint ventures15 988 8 003 Profi t for the year9 467 14 904 of which attributable to non-controlling interests 401 448 of which attributable to shareholders of the parent (Net profi t)9 066 14 456 As percentages of salesTrading operating profi Profi t for the year attributable to shareholders of the parent (Net profi t)
4 Earnings per share (in CHF)Basic earnings per Diluted earnings per Consolidated Financial Statements of the nestl Group 201561 Consolidated statement of comprehensive incomefor the year ended 31 December 2015In millions of CHFN otes2015 2014 Profi t for the year recognised in the income statement 9 467 14 904 Currency retranslations Recognised in translation reserve(4 061)2 660 Reclassifi ed from translation reserve to income statement102 1 003 Fair value adjustments on available-for-sale fi nancial instruments Recognised in fair value reserve(134)191 Reclassifi ed from fair value reserve to income statement(75)(4)Fair value adjustments on cash fl ow hedges Recognised in hedging reserve(5)31 Reclassifi ed from hedging reserve83 (87)Taxes14237 5 Share of other comprehensive income of associates and joint ventures15 Recognised in the reserves165 83 Reclassifi ed from the reserves to income statement (436)Items that are or may be reclassifi ed subsequently to the income statement(3 688)3 446 Remeasurement of defi ned benefi t plans10(370)(1 745)Taxes148 352 Share of other comprehensive income of associates and joint ventures15112 (153)Items that will never be reclassifi ed to the income statement(250)(1 546)Other comprehensive income for the year18(3 938)
5 1 900 Total comprehensive income for the year5 529 16 804 of which attributable to non-controlling interests317 556 of which attributable to shareholders of the parent5 212 16 248 Consolidated Financial Statements of the nestl Group 201562 Consolidated balance sheet as at 31 December 2015before appropriationsIn millions of CHFN otes2015 2014 AssetsCurrent assetsCash and cash equivalents13/174 884 7 448 Short-term investments13 921 1 433 Inventories68 153 9 172 Trade and other receivables7/1312 252 13 459 Prepayments and accrued income 583 565 Derivative assets13 337 400 Current income tax assets 874 908 Assets held for sale21 430 576 Total current assets29 434 33 961 Non-current assetsProperty.
6 Plant and equipment826 576 28 421 Goodwill932 772 34 557 Intangible assets919 236 19 800 Investments in associates and joint ventures158 675 8 649 Financial assets135 419 5 493 Employee benefi ts assets10 109 383 Current income tax assets 128 128 Deferred tax assets141 643 2 058 Total non-current assets94 558 99 489 Total assets123 992 133 450 Consolidated Financial Statements of the nestl Group 201563 Consolidated balance sheet as at 31 December 2015In millions of CHFN otes2015 2014 Liabilities and equityCurrent liabilitiesFinancial debt139 629 8 810 Trade and other payables1317 038 17 437 Accruals and deferred income3 673 3 759 Provisions12 564 695 Derivative liabilities131 021 757 Current income tax liabilities1 124 1 264 Liabilities directly associated with assets held for sale 2 272 173 Total current liabilities33 321 32 895 Non-current liabilitiesFinancial debt1311 601 12 396 Employee benefi ts liabilities107 691 8 081 Provisions122 601 3 161 Deferred tax liabilities143 063 3 191 Other payables131 729 1 842 Total non-current liabilities26 685 28 671 Total liabilities60 006 61 566 Equity18 Share capital 319 322 Treasury shares (7 489)(3 918)Translation reserve(21 129)(17 255)
7 Retained earnings and other reserves90 637 90 981 Total equity attributable to shareholders of the parent62 338 70 130 Non-controlling interests1 648 1 754 Total equity63 986 71 884 Total liabilities and equity123 992 133 450 Consolidated Financial Statements of the nestl Group 201564 Consolidated cash fl ow statementfor the year ended 31 December 2015In millions of CHFN otes2015 2014 Operating activitiesOperating profi t17 12 408 10 905 Depreciation and amortisation3 178 3 058 Impairment576 2 067 Net result on disposal of businesses422 509 Other non-cash items of income and expense172 689 Cash fl ow before changes in operating assets and liabilities16 756 17 228 Decrease/(increase) in working capital17 741 (114)Variation of other operating assets and liabilities17 (248)85 Cash generated from operations17 249 17 199 Net cash fl ows from treasury activities17 (93)(356)Taxes paid(3 310)(2 859)Dividends and interest from associates and joint ventures15 456 716 Operating cash fl ow14 302 14 700 Investing activitiesCapital expenditure8 (3 872)(3 914)Expenditure on intangible assets9 (422)(509)Acquisition of businesses2 (530)(1 986)Disposal of businesses2 213 321 Investments (net of divestments) in associates and joint ventures (a)15 (44)3 958 Infl ows/(outfl ows) from treasury investments521 (844)Other investing activities(19)(98)Investing cash fl ow(4 153)(3 072)
8 Financing activitiesDividend paid to shareholders of the parent18 (6 950)(6 863)Dividends paid to non-controlling interests(424)(356)Acquisition (net of disposal) of non-controlling interests (49)Purchase (net of sale) of treasury shares (b)(6 377)(1 617)Infl ows from bonds and other non-current fi nancial debt 1 381 2 202 Outfl ows from bonds and other non-current fi nancial debt (508)(1 969)Infl ows/(outfl ows) from current fi nancial debt643 (1 985)Financing cash fl ow(12 235)(10 637)Currency retranslations(478)42 Increase/(decrease) in cash and cash equivalents(2 564)1 033 Cash and cash equivalents at beginning of year 7 448 6 415 Cash and cash equivalents at end of year 4 884 7 448 (a) In 2014, mainly relates to the partial disposal of L Or al shares.
9 The Group sold part of its shares to L Or al for a price of CHF 7342 million (see Note 15) in exchange for the remaining 50% stake in Galderma for an equity value of CHF 3201 million (see Note 2) and cash of CHF 4141 million.(b) Mostly relates to the Share Buy-Back Programme launched in 2014. Consolidated Financial Statements of the nestl Group 201565 Consolidated statement of changes in equityfor the year ended 31 December 2015In millions of CHFS hare capitalTreasurysharesTranslation reserveRetainedearnings andother reservesTotal equityattributable toshareholders of the parentNon-controlling interestsTotal equityEquity as at 31 December 2013322 (2 196)(20 811)85 260 62 575 1 564 64 139 Profi t for the year 14 456 14 456 448 14 904 Other comprehensive income for the year 3 556 (1 764)1 792 108 1 900 Total comprehensive income for the year 3 556 12 692 16 248 556 16 804 Dividend paid to shareholders of the parent (6 863)(6 863) (6 863)
10 Dividends paid to non-controlling interests (356)(356)Movement of treasury shares (1 943) 204 (1 739) (1 739)Equity compensation plans 221 (48)173 173 Changes in non-controlling interests (297)(297)(10)(307)Total transactions with owners (1 722) (7 004)(8 726)(366)(9 092)Other movements 33 33 33 Equity as at 31 December 2014322 (3 918)(17 255)90 981 70 130 1 754 71 884 Profi t for the year 9 066 9 066 401 9 467 Other comprehensive income for the year (3 874)20 (3 854)(84)(3 938)Total comprehensive income for the year (3 874)9 086 5 212 317 5 529 Dividend paid to shareholders of the parent (6 950)(6 950) (6 950)Dividends paid to non-controlling interests (424)(424)Movement of treasury shares (6 322) 39 (6 283) (6 283)Equity compensation plans 239 (56)183 183 Changes in non-controlling interests (21)(21)1 (20)Reduction in share capital (a)(3)2 512 (2 509) Total transactions with owners(3)(3 571) (9 497)(13 071)(423)(13 494)Other movements 67 67 67 Equity as at 31 December 2015319 (7 489)(21 129)90 637 62 338 1 648 63 986 (a) Reduction in share capital, see Note Consolidated Financial Statements of the nestl Group 201566 Consolidated Financial Statements of the nestl Group 201567 Notes1.