Transcription of Financial Statements 2016 - Nestlé
1 FinancialStatements 2016 Consolidated Financial Statements of the nestl Group 2016150th Financial Statementsof nestl Financial Statements of the nestl Group 2016 Consolidated Financial Statements of the nestl Group 2016585960616264656767707482838485889410 4106118121123124127132133135 Principal exchange ratesConsolidated income statement forthe year ended 31 December 2016 Consolidated statement of comprehensive income for the year ended 31 December 2016 Consolidated balance sheet as at31 December 2016 Consolidated cash fl ow statement for the year ended 31 December 2016 Consolidated statement of changes in equity for the year ended 31 December 2016 Notes1. Accounting policies2. Scope of consolidation, acquisitions and disposals of businesses, assets held for sale and acquisitions of non-controlling interests3. Analyses by segment4. Net other trading and operating income/ (expenses)5.
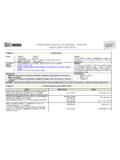
2 Net fi nancial income/(expense)6. Inventories7. Trade and other receivables8. Property, plant and equipment9. Goodwill and intangible assets10. Employee benefi ts11. Provisions and contingencies12. Financial instruments13. Taxes14. Associates and joint ventures15. Earnings per share16. Cash fl ow statement17. Equity18. Lease commitments19. Transactions with related parties20. Guarantees21. Events after the balance sheet dateStatutory Auditor s Report Report on the Audit of the Consolidated Financial StatementsFinancial information 5 year reviewCompanies of the nestl Group, joint arrangements and associates136142144 Consolidated Financial Statements of the nestl Group 201659 Principal exchange ratesCHF per2016 2015 2016 2015 Year ending ratesWeighted average annual rates1 US Euro Chinese Yuan Brazilian Philippine Pound Mexican Canadian Japanese Australian Russian Financial Statements of the nestl Group 201660 Consolidated income statementfor the year ended 31 December 2016In millions of CHFN otes20162015 Sales389 469 88 785 Other revenue 317 298 Cost of goods sold(44 199)(44 730)Distribution expenses(8 059)(7 899)Marketing and administration expenses(21 485)(20 744)Research and development costs (1 736)(1 678)Other trading income4 99 78 Other trading expenses4(713)(728)
3 Trading operating profi t313 693 13 382 Other operating income4 354 126 Other operating expenses4(884)(1 100)Operating profi t13 163 12 408 Financial income5 121 101 Financial expense5(758)(725)Profi t before taxes, associates and joint ventures12 526 11 784 Taxes13(4 413)(3 305)Income from associates and joint ventures14 770 988 Profi t for the year8 883 9 467 of which attributable to non-controlling interests 352 401 of which attributable to shareholders of the parent (Net profi t)8 531 9 066 As percentages of salesTrading operating profi Profi t for the year attributable to shareholders of the parent (Net profi t) Earnings per share (in CHF)Basic earnings per Diluted earnings per Consolidated Financial Statements of the nestl Group 201661 Consolidated statement of comprehensive incomefor the year ended 31 December 2016In millions of CHFN otes2016 2015 Profi t for the year recognised in the income statement 8 883 9 467 Currency retranslations, net of taxes171 033 (3 771)Fair value adjustments on available-for-sale fi nancial instruments, net of taxes1716 (144)Fair value adjustments on cash fl ow hedges, net of taxes17(1)62 Share of other comprehensive income of associates and joint ventures14/17(154)165 Items that are or may be reclassifi ed subsequently to the income statement894 (3 688)Remeasurement of defi ned benefi t plans, net of taxes10/17(143)(362)Share of other comprehensive income of associates and joint ventures14/17(10)112 Items that will never be reclassifi ed to the income statement(153)(250)
4 Other comprehensive income for the year17741 (3 938)Total comprehensive income for the year9 624 5 529 of which attributable to non-controlling interests343 317 of which attributable to shareholders of the parent9 281 5 212 Consolidated Financial Statements of the nestl Group 201662 Consolidated balance sheet as at 31 December 2016before appropriationsIn millions of CHFN otes2016 2015 AssetsCurrent assetsCash and cash equivalents12/167 990 4 884 Short-term investments121 306 921 Inventories68 401 8 153 Trade and other receivables7/1212 411 12 252 Prepayments and accrued income 573 583 Derivative assets12 550 337 Current income tax assets 786 874 Assets held for sale2 25 1 430 Total current assets32 042 29 434 Non-current assetsProperty, plant and equipment827 554 26 576 Goodwill933 007 32 772 Intangible assets920 397 19 236 Investments in associates and joint ventures1410 709 8 675 Financial assets125 719 5 419 Employee benefi ts assets10 310 109 Current income tax assets 114 128 Deferred tax assets132 049 1 643 Total non-current assets99 859 94 558 Total assets131 901 123 992 Consolidated Financial Statements of the nestl Group 201663 Consolidated balance sheet as at 31 December 2016In millions of CHFN otes2016 2015 Liabilities and equityCurrent liabilitiesFinancial debt1212 118 9 629 Trade and other payables1218 629 17 038 Accruals and deferred income3 855 3 673 Provisions11 620 564 Derivative liabilities121 068 1 021 Current income tax liabilities1 221 1 124 Liabilities directly associated with assets held for sale 2 6 272 Total current liabilities37 517 33 321 Non-current liabilitiesFinancial debt1211 091 11 601 Employee benefi ts
5 Liabilities108 420 7 691 Provisions112 640 2 601 Deferred tax liabilities133 865 3 063 Other payables122 387 1 729 Total non-current liabilities28 403 26 685 Total liabilities65 920 60 006 Equity17 Share capital 311 319 Treasury shares (990)(7 489)Translation reserve(18 799)(19 851)Other reserves1 198 1 345 Retained earnings82 870 88 014 Total equity attributable to shareholders of the parent64 590 62 338 Non-controlling interests1 391 1 648 Total equity65 981 63 986 Total liabilities and equity131 901 123 992 Consolidated Financial Statements of the nestl Group 201664 Consolidated cash fl ow statementfor the year ended 31 December 2016In millions of CHFN otes2016 2015 Operating activitiesOperating profi t17 13 163 12 408 Depreciation and amortisation3 132 3 178 Impairment640 576 Net result on disposal of businesses 422 Other non-cash items of income and expense35 172 Cash fl ow before changes in operating assets and liabilities16 970 16 756 Decrease/(increase) in working capital16 1 801 741 Variation of other operating assets and liabilities16 54 (248)Cash generated from operations18 825 17 249 Net cash fl ows from treasury activities16 (327)(93)Taxes paid(3 435)(3 310)
6 Dividends and interest from associates and joint ventures14 519 456 Operating cash fl ow15 582 14 302 Investing activitiesCapital expenditure8 (4 010)(3 872)Expenditure on intangible assets9 (682)(422)Acquisition of businesses2 (585)(530)Disposal of businesses2 271 213 Investments (net of divestments) in associates and joint ventures14 (748)(44)Infl ows/(outfl ows) from treasury investments(335)521 Other investing activities(34)(19)Investing cash fl ow(6 123)(4 153)Financing activitiesDividend paid to shareholders of the parent17 (6 937)(6 950)Dividends paid to non-controlling interests(432)(424)Acquisition (net of disposal) of non-controlling interests2(1 208) Purchase (net of sale) of treasury shares (a)760 (6 377)Infl ows from bonds and other non-current fi nancial debt 1 695 1 381 Outfl ows from bonds and other non-current fi nancial debt (1 430)(508)Infl ows/(outfl ows) from current fi nancial debt1 368 643 Financing cash fl ow(6 184)(12 235)Currency retranslations(169)(478)Increase/(decrea se) in cash and cash equivalents3 106 (2 564)Cash and cash equivalents at beginning of year 4 884 7 448 Cash and cash equivalents at end of year 7 990 4 884 (a) In 2015, mostly relates to the Share Buy-Back Programme launched in 2014.
7 Consolidated Financial Statements of the nestl Group 201665 Consolidated statement of changes in equityfor the year ended 31 December 2016In millions of CHFS hare capitalTreasurysharesTranslation reserveOther reservesRetainedearningsTotal equityattributable toshareholders of the parentNon-controlling interestsTotal equityEquity as at 31 December 2014 as originally published322 (3 918) (17 255) 90 981 70 130 1 754 71 884 Reclassifi cation following the changes in presentation 953 1 418 (2 371) Equity restated as at 31 December 2014322 (3 918) (16 302)1 418 88 610 70 130 1 754 71 884 Profi t for the year 9 066 9 066 401 9 467 Other comprehensive income for the year (3 549)(55)(250)(3 854)(84)(3 938)Total comprehensive income for the year (3 549)(55)8 816 5 212 317 5 529 Dividends (6 950)(6 950)(424)(7 374)Movement of treasury shares (6 322) 39 (6 283) (6 283)Equity compensation plans 239 (56)183 183 Changes in non-controlling interests (21)(21)1 (20)Reduction in share capital (a)(3)2 512 (2 509) Total transactions with owners(3)(3 571) (9 497)(13 071)(423)(13 494)Other movements (18)85 67 67 Equity restated as at 31 December 2015319 (7 489) (19 851)1 345 88 014 62 338 1 648 63 986 Profi t for the year 8 531 8 531 352 8 883 Other comprehensive income for the year 1 052 (148)(154)750 (9)741 Total comprehensive income for the year 1 052 (148)8 377 9 281 343 9 624 Dividends (6 937)(6 937)(432)(7 369)Movement of treasury shares 803 (27)776 776 Equity compensation plans 207 (27)180 180 Changes in non-controlling interests (b) (991)(991)(168)(1 159)Reduction in share capital (a)(8)5 489 (5 481) Total transactions with owners(8)6 499 (13 463)(6 972)(600)(7 572)
8 Other movements 1 (58)(57) (57)Equity as at 31 December 2016311 (990) (18 799)1 198 82 870 64 590 1 391 65 981 (a) Reduction in share capital, see Note (b) Movements reported under retained earnings include the impact of the acquisitions during the period (see Note )as well as a put option for the acquisition of non-controlling interests. Consolidated Financial Statements of the nestl Group 201666 Consolidated Financial Statements of the nestl Group 201667 Notes1. Accounting policiesAccounting convention and accounting standardsThe Consolidated Financial Statements comply with International Financial Reporting Standards (IFRS) issued by the International Accounting Standards Board (IASB) and with Swiss have been prepared on an accrual basis and under the historical cost convention, unless stated otherwise. All signifi cant consolidated companies, joint arrangements and associates have a 31 December accounting year-end.
9 The Consolidated Financial Statements 2016 were approved for issue by the Board of Directors on 15 February 2017 and are subject to approval by the Annual General Meeting on 6 April 2017. Accounting policiesAccounting policies are included in the relevant notes to the Consolidated Financial Statements and are presented as text highlighted with a grey background. The accounting policies below are applied throughout the fi nancial accounting judgements, estimates and assumptionsThe preparation of the Consolidated Financial Statements requires Group Management to exercise judgement and to make estimates and assumptions that affect the application of policies, reported amounts of revenues, expenses, assets and liabilities and disclosures. These estimates and associated assumptions are based on historical experience and various other factors that are believed to be reasonable under the circumstances. Actual results may differ from these estimates.
10 The estimates and underlying assumptions are reviewed on an ongoing basis. Revisions to accounting estimates are recognised in the period in which the estimate is revised if the revision affects only that period, or in the period of the revision and future periods if the revision affects both current and future periods. Those areas affect mainly provisions and contingencies (see Note 11), goodwill and intangible assets with indefi nite useful life impairment tests (see Note 9), employee benefi ts (see Note 10), allowance for doubtful receivables (see Note 7) and taxes (see Note 13).Foreign currenciesThe functional currency of the Group s entities is the currency of their primary economic individual companies, transactions in foreign currencies are recorded at the rate of exchange at the date of the transaction. Monetary assets and liabilities in foreign currencies are translated at year-end rates. Any resulting exchange differences are taken to the income statement, except when deferred in other comprehensive income as qualifying cash fl ow consolidation, assets and liabilities of foreign operations reported in their functional currencies are translated into Swiss Francs, the Group s presentation currency, at year-end exchange rates.