Transcription of Financial Statements 2018 - Nestlé
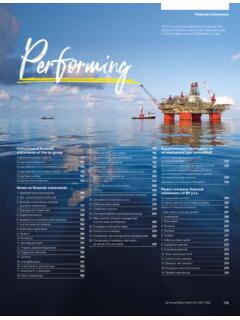
1 FinancialStatements 2018 Consolidated Financial Statements of the nestl Group 2018152nd Financial Statementsof nestl Financial Statements of the nestl Group 201863 ConsolidatedFinancial Statementsof the nestl Group 2018 Consolidated Financial Statements of the nestl Group 2018646566676870 7173737783939495971011071171191341371391 40143148150 Principal exchange ratesConsolidated income statement forthe year ended December 31, 2018 Consolidated statement of comprehensive income for the year ended December 31, 2018 Consolidated balance sheet as atDecember 31, 2018 Consolidated cash fl ow statement for the year ended December 31, 2018 Consolidated statement of changes in equity for the year ended December 31, 2018 Notes1. Accounting policies2. Scope of consolidation, acquisitions and disposals of businesses, assets held for sale and acquisitions of non-controlling interests3.
2 Analyses by segment4. Net other trading and operating income/ (expenses)5. Net fi nancial income/(expense)6. Inventories7. Trade and other receivables/payables8. Property, plant and equipment9. Goodwill and intangible assets10. Employee benefi ts11. Provisions and contingencies12. Financial instruments13. Taxes14. Associates and joint ventures15. Earnings per share16. Cash fl ow statement17. Equity18. Transactions with related parties19. Guarantees20. Effects of hyperinfl ation21. Events after the balance sheet date22. Restatements of 2017 comparatives and fi rst application of IFRS 9 Statutory Auditor s Report Report on the Audit of the Consolidated Financial StatementsFinancial information 5 year reviewCompanies of the nestl Group, joint arrangements and associates160166168 Consolidated Financial Statements of the nestl Group 201865 Principal exchange ratesCHF per2018 2017 2018 2017 Year ending ratesWeighted average annual rates1 US Euro Chinese Yuan Brazilian Philippine Pound Mexican Canadian Japanese Australian Russian Financial Statements of the nestl Group 201866 Consolidated income statementfor the year ended December 31, 2018In millions of CHFN otes20182017 *Sales391 439 89 590 Other revenue 311 332 Cost of goods sold(46 070)(45 571)
3 Distribution expenses(8 469)(8 023)Marketing and administration expenses(20 003)(19 818)Research and development costs (1 687)(1 739)Other trading income4 37 112 Other trading expenses4(1 769)(1 606)Trading operating profi t313 789 13 277 Other operating income42 535 379 Other operating expenses4(2 572)(3 500)Operating profi t13 752 10 156 Financial income5 247 152 Financial expense5(1 008)(848)Profi t before taxes, associates and joint ventures12 991 9 460 Taxes13(3 439)(2 773)Income from associates and joint ventures14 916 824 Profi t for the year10 468 7 511 of which attributable to non-controlling interests 333 355 of which attributable to shareholders of the parent (Net profi t)10 135 7 156 As percentages of salesTrading operating profi Profi t for the year attributable to shareholders of the parent (Net profi t) Earnings per share (in CHF)Basic earnings per Diluted earnings per * 2017 restated fi gures include modifi cations as described in Note 1 Accounting policies and related impacts in Note 22.
4 Consolidated Financial Statements of the nestl Group 201867 Consolidated statement of comprehensive incomefor the year ended December 31, 2018In millions of CHFN otes20182017 *Profi t for the year recognized in the income statement 10 468 7 511 Currency retranslations, net of taxes17(1 004)(561)Fair value changes on available-for-sale fi nancial instruments, net of taxes17 (10)Fair value changes on debt instruments, net of taxes17(39) Fair value changes on cash fl ow hedges, net of taxes46 (55)Share of other comprehensive income of associates and joint ventures14/17(21)(240)Items that are or may be reclassifi ed subsequently to the income statement(1 018)(866)Remeasurement of defi ned benefi t plans, net of taxes10/17600 1 063 Fair value changes on equity instruments, net of taxes174 Share of other comprehensive income of associates and joint ventures14/17117 52 Items that will never be reclassifi ed to the income statement721 1 115 Other comprehensive income for the year17(297)249 Total comprehensive income for the year10 171 7 760 of which attributable to non-controlling interests218 328 of which attributable to shareholders of the parent9 953 7 432 * 2017 restated fi gures include modifi cations as described in Note 1 Accounting policies and related impacts in Note 22.
5 Consolidated Financial Statements of the nestl Group 201868 Consolidated balance sheet as at December 31, 2018before appropriationsIn millions of CHFN otes20182017 *AssetsCurrent assetsCash and cash equivalents12/164 500 7 938 Short-term investments125 801 655 Inventories69 125 9 177 Trade and other receivables7/1211 167 12 036 Prepayments and accrued income 530 573 Derivative assets12 183 231 Current income tax assets 869 917 Assets held for sale28 828 357 Total current assets41 003 31 884 Non-current assetsProperty, plant and equipment829 956 30 777 Goodwill931 702 29 746 Intangible assets918 634 20 615 Investments in associates and joint ventures1410 792 11 628 Financial assets122 567 6 003 Employee benefi ts assets10 487 392 Current income tax assets 58 62 Deferred tax assets131 816 2 103 Total non-current assets96 012 101 326 Total assets137 015 133 210 * 2017 restated fi gures include modifi cations as described in Note 1 Accounting policies and related impacts in Note 22.
6 Consolidated Financial Statements of the nestl Group 201869 Consolidated balance sheet as at December 31, 2018In millions of CHFN otes20182017 *Liabilities and equityCurrent liabilitiesFinancial debt1214 694 11 211 Trade and other payables7/1217 800 18 864 Accruals and deferred income4 075 4 299 Provisions11 780 819 Derivative liabilities12 448 507 Current income tax liabilities2 731 2 477 Liabilities directly associated with assets held for sale 22 502 12 Total current liabilities43 030 38 189 Non-current liabilitiesFinancial debt1225 700 18 566 Employee benefi ts liabilities105 919 7 111 Provisions111 033 1 147 Deferred tax liabilities132 540 3 492 Other payables12 390 2 476 Total non-current liabilities35 582 32 792 Total liabilities78 612 70 981 Equity17 Share capital 306 311 Treasury shares (6 948)(4 537)Translation reserve(20 432)(19 436)Other reserves(183)
7 989 Retained earnings84 620 83 629 Total equity attributable to shareholders of the parent57 363 60 956 Non-controlling interests1 040 1 273 Total equity58 403 62 229 Total liabilities and equity137 015 133 210 * 2017 restated fi gures include modifi cations as described in Note 1 Accounting policies and related impacts in Note 22. Consolidated Financial Statements of the nestl Group 201870 Consolidated cash fl ow statementfor the year ended December 31, 2018In millions of CHFN otes20182017 *Operating activitiesOperating profi t16 13 752 10 156 Depreciation and amortization16 3 924 3 934 Impairment1 248 3 582 Net result on disposal of businesses4(686)132 Other non-cash items of income and expense16 137 (186)Cash fl ow before changes in operating assets and liabilities18 375 17 618 Decrease/(increase) in working capital16 472 (244)Variation of other operating assets and liabilities16 (37)361 Cash generated from operations18 810 17 735 Interest paid(684)(609)Interest and dividend received192 119 Taxes paid(3 623)(3 628)
8 Dividends and interest from associates and joint ventures14 703 582 Operating cash fl ow15 398 14 199 Investing activitiesCapital expenditure8 (3 869)(3 938)Expenditure on intangible assets9 (601)(769)Acquisition of businesses2 (9 512)(696)Disposal of businesses2 4 310 140 Investments (net of divestments) in associates and joint ventures14 728 (140)Infl ows/(outfl ows) from treasury investments(5 159)587 Other investing activities(163)(134)Investing cash fl ow(14 266)(4 950)Financing activitiesDividend paid to shareholders of the parent17 (7 124)(7 126)Dividends paid to non-controlling interests(319)(342)Acquisition (net of disposal) of non-controlling interests2 (528)(526)Purchase (net of sale) of treasury shares (a)(6 854)(3 295)Infl ows from bonds and other non-current fi nancial debt 12 9 900 6 406 Outfl ows from bonds and other non-current fi nancial debt 12 (2 712)(3 190)Infl ows/(outfl ows) from current fi nancial debt12 3 520 (1 011)Financing cash fl ow(4 117)(9 084)Currency retranslations(313)(217)Increase/(decrea se) in cash and cash equivalents(3 298)(52)Cash and cash equivalents at beginning of year 7 938 7 990 Cash and cash equivalents at end of year 16 4 640 7 938 * 2017 restated fi gures include modifi cations as described in Note 1 Accounting policies and related impacts in Note 22.
9 (a) Mostly relates to the Share Buy-Back Program launched in 2017. Consolidated Financial Statements of the nestl Group 201871 Consolidated statement of changes in equityfor the year ended December 31, 2018In millions of CHFS hare capitalTreasurysharesTranslation reserveOtherreservesRetainedearningsTota l equityattributable toshareholders of the parentNon-controlling interestsTotal equityEquity as at December 31, 2016 as originally published311 (990) (18 799)1 198 82 870 64 590 1 391 65 981 First application of IFRS 15 (268)(268) (268)First application of IFRS 16 (189)(189) (189)Other (61)(61) (61)Equity restated as at January 1, 2017 *311 (990) (18 799)1 198 82 352 64 072 1 391 65 463 Profi t for the year * 7 156 7 156 355 7 511 Other comprehensive income for the year * (637)(209)1 122 276 (27)
10 249 Total comprehensive income for the year * (637)(209)8 278 7 432 328 7 760 Dividends (7 126)(7 126)(342)(7 468)Movement of treasury shares (3 719) 113 (3 606) (3 606)Equity compensation plans 172 (11)161 161 Changes in non-controlling interests (a) 93 93 (104)(11)Total transactions with owners (3 547) (6 931)(10 478)(446)(10 924)Other movements (70)(70) (70)Equity restated at December 31, 2017311 (4 537) (19 436)989 83 629 60 956 1 273 62 229 * 2017 restated fi gures include modifi cations as described in Note 1 Accounting policies and related impacts in Note 22.(a) Movements reported under retained earnings include the impact of the acquisitions (see Note ) as well as put options for acquisitions of non-controlling interests.
