Transcription of Financial Statements 2019 - Nestlé
1 Financial Statements 2019 Consolidated Financial Statements of the nestl Group 2019153rd Financial Statements of nestl Financial Statements of the nestl Group 201963 ConsolidatedFinancial Statementsof the nestl Group 2019 Consolidated Financial Statements of the nestl Group 2019646566676870 7173737581919293959910511411613013313513 6138143144145 Principal exchange ratesConsolidated income statement for the year ended December 31, 2019 Consolidated statement of comprehensive income for the year ended December 31, 2019 Consolidated balance sheet as at December 31, 2019 Consolidated cash flow statement for the year ended December 31, 2019 Consolidated statement of changes in equity for the year ended December 31, 2019 Notes1. Accounting policies2. Scope of consolidation, acquisitions and disposals of businesses, assets held for sale and acquisitions of non-controlling interests3.
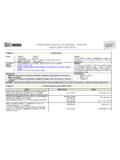
2 Analyses by segment4. Net other trading and operating income/ (expenses)5. Net Financial income/(expense)6. Inventories7. Trade and other receivables/payables8. Property, plant and equipment9. Goodwill and intangible assets10. Employee benefits11. Provisions and contingencies12. Financial instruments13. Taxes14. Associates and joint ventures15. Earnings per share16. Cash flow statement17. Equity18. Transactions with related parties19. Guarantees20. Effects of hyperinflation21. Events after the balance sheet dateStatutory Auditor s Report Report on the Audit of the Consolidated Financial StatementsFinancial information 5 year reviewCompanies of the nestl Group, joint arrangements and associates146152154 Consolidated Financial Statements of the nestl Group 201965 Principal exchange rates CHF per2019 2018 2019 2018 Year ending ratesWeighted average annual rates1 US Euro Chinese Yuan Brazilian Philippine Pound Mexican Canadian Japanese Australian Russian Financial Statements of the nestl Group 201966 Consolidated income statement for the year ended December 31, 2019In millions of CHFN otes20192018 Sales392 568 91 439 Other revenue 297 311 Cost of goods sold(46 647)(46 070)Distribution expenses(8 496)(8 469)Marketing and administration expenses(19 790)
3 (20 003)Research and development costs (1 672)(1 687)Other trading income4 163 37 Other trading expenses4(2 749)(1 769)Trading operating profit313 674 13 789 Other operating income43 717 2 535 Other operating expenses4(1 313)(2 572)Operating profit16 078 13 752 Financial income5 200 247 Financial expense5(1 216)(1 008)Profit before taxes, associates and joint ventures15 062 12 991 Taxes13(3 159)(3 439)Income from associates and joint ventures141 001 916 Profit for the year12 904 10 468 of which attributable to non-controlling interests 295 333 of which attributable to shareholders of the parent (Net profit)12 609 10 135 As percentages of salesTrading operating Profit for the year attributable to shareholders of the parent (Net profit) Earnings per share (in CHF)Basic earnings per Diluted earnings per Consolidated Financial Statements of the nestl Group 201967 Consolidated statement of comprehensive income for the year ended December 31, 2019In millions of CHFN otes20192018 Profit for the year recognized in the income statement 12 904 10 468 Currency retranslations, net of taxes17(1 050)(1 004)Fair value changes and recycling on debt instruments, net of taxes17 (39)Fair value changes and recycling on cash flow hedges, net of taxes(66)46 Share of other comprehensive income of associates and joint ventures14/1749 (21)Items that are or may be reclassified subsequently to the income statement(1 067)(1 018)Remeasurement of defined benefit plans, net of taxes10/17(320)600 Fair value changes on equity instruments, net of taxes17(4)
4 4 Share of other comprehensive income of associates and joint ventures14/17337 117 Items that will never be reclassified to the income statement13 721 Other comprehensive income for the year17(1 054)(297)Total comprehensive income for the year11 850 10 171 of which attributable to non-controlling interests317 218 of which attributable to shareholders of the parent11 533 9 953 Consolidated Financial Statements of the nestl Group 201968 Consolidated balance sheet as at December 31, 2019before appropriationsIn millions of CHFN otes20192018 AssetsCurrent assetsCash and cash equivalents12/167 469 4 500 Short-term investments122 794 5 801 Inventories69 343 9 125 Trade and other receivables7/1211 766 11 167 Prepayments and accrued income 498 530 Derivative assets12 254 183 Current income tax assets 768 869 Assets held for sale22 771 8 828 Total current assets35 663 41 003 Non-current assetsProperty.
5 Plant and equipment828 762 29 956 Goodwill928 896 31 702 Intangible assets917 824 18 634 Investments in associates and joint ventures1411 505 10 792 Financial assets122 611 2 567 Employee benefits assets10 510 487 Current income tax assets 55 58 Deferred tax assets132 114 1 816 Total non-current assets92 277 96 012 Total assets127 940 137 015 Consolidated Financial Statements of the nestl Group 201969 Consolidated balance sheet as at December 31, 2019In millions of CHFN otes20192018 Liabilities and equityCurrent liabilitiesFinancial debt1214 032 14 694 Trade and other payables7/1218 803 17 800 Accruals and deferred income4 492 4 075 Provisions11 802 780 Derivative liabilities12 420 448 Current income tax liabilities2 673 2 731 Liabilities directly associated with assets held for sale 2 393 2 502 Total current liabilities41 615 43 030 Non-current liabilitiesFinancial debt1223 132 25 700 Employee benefits liabilities106 151 5 919 Provisions111 162 1 033 Deferred tax liabilities132 589 2 540 Other payables12 429 390 Total non-current liabilities33 463 35 582 Total liabilities75 078 78 612 Equity17 Share capital 298 306 Treasury shares (9 752)(6 948)Translation reserve(21 526)(20 432)Other reserves(45)(183)
6 Retained earnings83 060 84 620 Total equity attributable to shareholders of the parent52 035 57 363 Non-controlling interests 827 1 040 Total equity52 862 58 403 Total liabilities and equity127 940 137 015 Consolidated Financial Statements of the nestl Group 201970 Consolidated cash flow statement for the year ended December 31, 2019In millions of CHFN otes20192018 Operating activitiesOperating profit16 16 078 13 752 Depreciation and amortization16 3 713 3 924 Impairment2 336 1 248 Net result on disposal of businesses4 (3 416)(686)Other non-cash items of income and expense16 (28)137 Cash flow before changes in operating assets and liabilities18 683 18 375 Decrease/(increase) in working capital16 349 472 Variation of other operating assets and liabilities16 (94)(37)Cash generated from operations18 938 18 810 Interest paid(1 028)(684)Interest and dividend received162 192 Taxes paid(2 854)(3 623)Dividends and interest from associates and joint ventures14 632 703 Operating cash flow15 850 15 398 Investing activitiesCapital expenditure8 (3 695)(3 869)Expenditure on intangible assets9 (516)(601)Acquisition of businesses2 (125)(9 512)Disposal of businesses2 9 959 4 310 Investments (net of divestments) in associates and joint ventures14 (540)728 Inflows/(outflows) from treasury investments2 978 (5 159)Other investing activities295 (163)Investing cash flow8 356 (14 266)Financing activitiesDividend paid to shareholders of the parent17 (7 230)(7 124)Dividends paid to non-controlling interests(463)(319)Acquisition (net of disposal) of non-controlling interests2 (16)(528)
7 Purchase (net of sale) of treasury shares (a)(9 773)(6 854)Inflows from bonds and other non-current Financial debt 12 57 9 900 Outflows from bonds and other non-current Financial debt 12 (3 287)(2 712)Inflows/(outflows) from current Financial debt12 (444)3 520 Financing cash flow(21 156)(4 117)Currency retranslations(221)(313)Increase/(decrea se) in cash and cash equivalents2 829 (3 298)Cash and cash equivalents at beginning of year 4 640 7 938 Cash and cash equivalents at end of year 16 7 469 4 640 (a) Mostly relates to the share buyback program launched in Financial Statements of the nestl Group 201971 Consolidated statement of changes in equity for the year ended December 31, 2019In millions of CHFS hare capitalTreasury sharesTranslation reserveOther reservesRetained earningsTotal equity attributable to shareholders of the parentNon-controlling interestsTotal equityEquity as at January 1, 2018311 (4 537)(19 612)(181)84 962 60 943 1 271 62 214 Profit for the year 10 135 10 135 333 10 468 Other comprehensive income for the year (893)(12)723 (182)(115)(297)Total comprehensive income for the year (893)(12)10 858 9 953 218 10 171 Dividends (7 124)(7 124)(319)(7 443)Movement of treasury shares (6 677) (49)(6 726) (6 726)Equity compensation plans 153 (3)
8 150 3 153 Changes in non-controlling interests 181 181 (133)48 Reduction in share capital (a)(5)4 113 (4 108) Total transactions with owners(5)(2 411) (11 103)(13 519)(449)(13 968)Other movements 73 10 (97)(14) (14)Equity as at December 31, 2018306 (6 948)(20 432)(183)84 620 57 363 1 040 58 403 Equity as at January 1, 2019306 (6 948)(20 432)(183)84 620 57 363 1 040 58 403 Profit for the year 12 609 12 609 295 12 904 Other comprehensive income for the year (1 094)(7)25 (1 076)22 (1 054)Total comprehensive income for the year (1 094)(7)12 634 11 533 317 11 850 Dividends (7 230)(7 230)(463)(7 693)Movement of treasury shares (9 946) 175 (9 771) (9 771)Equity compensation plans 280 (142)138 (1)137 Changes in non-controlling interests 4 4 (68)(64)Reduction in share capital (a)(8)6 862 (6 854) Total transactions with owners(8)(2 804) (14 047)(16 859)(532)(17 391)Other movements 145 (147)(2)2 Equity as at December 31, 2019298 (9 752)(21 526)(45)83 060 52 035 827 52 862 (a) Reduction in share capital, see Note Financial Statements of the nestl Group 201972 Consolidated Financial Statements of the nestl Group 201973 Notes1.
9 Accounting policiesAccounting convention and accounting standardsThe Consolidated Financial Statements comply with International Financial Reporting Standards (IFRS) issued by the International Accounting Standards Board (IASB) and with Swiss have been prepared on a historical cost basis, unless stated otherwise. All significant consolidated companies, joint arrangements and associates have a December 31 accounting year-end. The Consolidated Financial Statements 2019 were approved for issue by the Board of Directors on February 12, 2020, and are subject to approval by the Annual General Meeting on April 23, 2020. Accounting policiesAccounting policies are included in the relevant notes to the Consolidated Financial Statements and are presented as text highlighted with a grey background. The accounting policies below are applied throughout the Financial accounting judgements, estimates and assumptionsThe preparation of the Consolidated Financial Statements requires Group Management to exercise judgement and to make estimates and assumptions that affect the application of policies, reported amounts of revenues, expenses, assets and liabilities and disclosures.
10 These estimates and associated assumptions are based on historical experience and various other factors that are believed to be reasonable under the circumstances. The estimates and underlying assumptions are reviewed on an ongoing basis. Actual results may differ from these estimates. Those areas that involved a higher degree of judgement or uncertainty are explained further in the relevant notes, including classification and measurement of assets held for sale (see Note 2), recognition and estimation of revenue (see Note 3), presentation of additional line items and sub-totals in the income statement (see Note 4), identification of a lease and lease term (see Note 8), identification of cash generating units (CGUs) and estimation of recoverable amount for impairment tests (see Note 9), assessment of useful lives of intangible assets as finite or indefinite (see Note 9), measurement of employee benefit obligations (see Note 10), recognition and measurement of provisions (see Note 11) and estimation of current and deferred taxes (see Note 13).