Transcription of Finland - OECD
1 The Programme for International Student Assessment (PISA) is a triennial survey of 15-year-old students around the world that assesses the extent to which they have acquired the key knowledge and skills essential for full participation in society. The assessment focuses on reading, mathematics and science. Students proficiency in an innovative domain is also assessed; in 2018, this domain was global competence. Finland Key findings Students in Finland scored higher than the OECD average in reading (520 score points), mathematics (507) and science (522). In reading, the four participating Chinese provinces/municipalities (Beijing, Shanghai, Jiangsu and Zhejiang) outperformed Finland , while Canada, Estonia, Hong Kong (China), Ireland, Korea and Macao (China) scored around the same level as Finland . In mathematics, 11 countries/economies outperformed Finland , while Belgium, Canada, Denmark, Slovenia, Sweden and the United Kingdom scored around the same level as Finland .
2 In science, the four participating Chinese provinces/municipalities, Estonia, Japan, Macao (China) and Singapore outperformed Finland , while Canada, Hong Kong (China), Korea and Chinese Taipei scored around the same level as Finland . Mean reading, mathematics and science performance continued to decline in Finland . In all three subjects, the decline began after 2006. Although PISA 2018 results were significantly lower than PISA 2015 results only in science, the negative trend line shows no sign of a reversal of performance in any subject. In mathematics, declines were similarly rapid at all levels of the performance distribution; in reading and science, in contrast, the declining trend was particularly noticeable amongst the lowest-achieving students. The gender gap in reading in Finland (52 score points) was one of the widest across all PISA 2018-participating countries/economies. The gap was similar to that observed in 2009 (55 score points), as both girls and boys performance declined over the period.
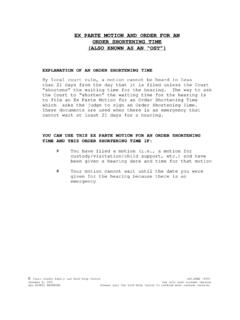
3 In Finland , the gap in performance related to students socio-economic status (79 score points) is smaller than the average difference between advantaged and disadvantaged students (89 score points) across OECD countries. However, in Finland , this gap widened since PISA 2009 (61 score points) while it remained the same on average across OECD countries. Some 67% of students in Finland hold a growth mindset they disagreed or strongly disagreed with the statement "Your intelligence is something about you that you can t change very much" (OECD average: 63%). Boys were less likely than girls, and disadvantaged students (60%) were less likely than advantaged students (76%) to hold a growth mindset. This latter gap (16 percentage points) is wider than the average across OECD countries (12 percentage points). 2 | Finland - Country Note - PISA 2018 Results OECD 2019 Volumes I-III What 15-year-old students in Finland know and can do Figure 1.
4 Snapshot of performance in reading, mathematics and science Note: Only countries and economies with available data are shown. Source: OECD, PISA 2018 Database, Tables and Students in Finland scored higher than the OECD average in reading, mathematics and science. Compared to the OECD average, a larger proportion of students in Finland performed at the highest levels of proficiency (Level 5 or 6) in at least one subject; at the same time a larger proportion of students achieved a minimum level of proficiency (Level 2 or higher) in at least one subject. What students know and can do in reading In Finland , 86% of students attained at least Level 2 proficiency in reading, significantly more than on average across OECD countries (77%). At a minimum, these students can identify the main idea in a text of moderate length, find information based on explicit, though sometimes complex criteria, and can reflect on the purpose and form of texts when explicitly directed to do so.
5 Over 85% of students in Beijing-Shanghai-Jiangsu-Zhejiang (China), Canada, Estonia, Finland , Hong Kong (China), Ireland, Macao (China), Poland and Singapore performed at this level or above. Some 14% of students in Finland were top performers in reading, meaning that they attained Level 5 or 6 in the PISA reading test (OECD average: 9%). At these levels, students can comprehend lengthy texts, deal with concepts that are abstract or counterintuitive, and establish distinctions between fact and opinion, based on implicit cues pertaining to the content or source of the information. In 20 education systems, including those of 15 OECD countries, more than 10% of 15-year-old students were top performers. What students know and can do in mathematics Some 85% of students in Finland attained Level 2 or higher in mathematics (OECD average: 76%). At a minimum, these students can interpret and recognise, without direct instructions, how a (simple) situation can be represented mathematically ( comparing the total distance across two alternative routes, or converting prices into a different currency).
6 The share of 15-year-old students who attained Finland - Country Note - PISA 2018 Results | 3 Volumes I-III OECD 2019 minimum levels of proficiency in mathematics (Level 2 or higher) varied widely from 98% in Beijing, Shanghai, Jiangsu and Zhejiang (China) to 2% in Zambia, which participated in the PISA for Development assessment in 2017. On average across OECD countries, 76% of students attained at least Level 2 proficiency in mathematics. In Finland , some 11% of students scored at Level 5 or higher in mathematics (OECD average: 11%). Six Asian countries and economies had the largest shares of students who did so: Beijing, Shanghai, Jiangsu and Zhejiang (China) (44%), Singapore (37%), Hong Kong (China) (29%), Macao (China) (28%), Chinese Taipei (23%) and Korea (21%). These students can model complex situations mathematically, and can select, compare and evaluate appropriate problem-solving strategies for dealing with them.
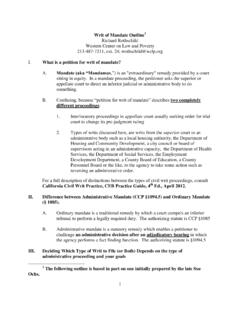
7 What students know and can do in science Some 87% of students in Finland attained Level 2 or higher in science (OECD average: 78%). At a minimum, these students can recognise the correct explanation for familiar scientific phenomena and can use such knowledge to identify, in simple cases, whether a conclusion is valid based on the data provided. More than 90% of students in Beijing-Shanghai-Jiangsu-Zhejiang (China) (nearly 98%), Macao (China) (94%), Estonia (just over 91%) and Singapore (91%) met this benchmark. In Finland , 12% of students were top performers in science, meaning that they were proficient at Level 5 or 6 (OECD average: 7%). These students can creatively and autonomously apply their knowledge of and about science to a wide variety of situations, including unfamiliar ones. Performance trends Figure 2. Trends in performance in reading, mathematics and science Notes:*indicates mean-performance estimates that are statistically significantly above or below PISA 2018 estimates for Finland .
8 The blue line indicates the average mean performance across OECD countries with valid data in all PISA assessments. The red dotted line indicates mean performance in Finland . The black line represents a trend line for Finland (line of best fit). Source: OECD, PISA 2018 Database, Tables I. , I. and I. Mean reading, mathematics and science performance continued to decline in Finland . In all three subjects the decline began after 2006. Although PISA 2018 results were significantly lower than PISA 4 | Finland - Country Note - PISA 2018 Results OECD 2019 Volumes I-III 2015 results only in science, the negative trend line shows no sign of a reversal of performance in any subject. In mathematics, declines were similarly rapid at all levels of the performance distribution; by contrast, in reading and science, the declining trend was particularly noticeable amongst the lowest-achieving students.
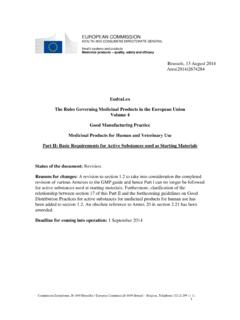
9 The proportion of top-performing students in mathematics shrank by 4 percentage points between 2012 and 2018, while the proportion of top-performing students in science decreased by 9 percentage points between 2006 and 2018. Meanwhile, the proportion of low-achieving students in reading grew by 5 percentage points between 2009 and 2018; the proportion of low-achieving students in mathematics grew by 3 percentage points between 2012 and 2018; and the share of low performers in science increased by 9 percentage points between 2006 and 2018. Where All Students Can Succeed Figure 3. Differences in performance and expectations related to personal characteristics Notes: Only countries and economies with available data are shown. (1) Girls minus boys performance; (2) Advantaged minus disadvantaged students performance; (3) Immigrants minus non-immigrants performance in reading; After accounting for students' and schools' socio-economic profile.
10 Source: OECD, PISA 2018 Database, Tables , and Equity related to socio-economic status In Finland , socio-economically advantaged students outperformed disadvantaged students in reading by 79 score points in PISA 2018. This is smaller than the average difference between the two groups (89 score points) across OECD countries. In PISA 2009, the performance gap related to socio-economic status was 61 score points in Finland (and 87 score points on average across OECD countries). Some 26% of advantaged students in Finland , but only 6% of disadvantaged students, were top performers in reading in PISA 2018. On average across OECD countries, 17% of advantaged students, and 3% of disadvantaged students, were top performers in reading. Finland - Country Note - PISA 2018 Results | 5 Volumes I-III OECD 2019 Socio-economic status was also a strong predictor of performance in mathematics and science in all PISA participating countries.