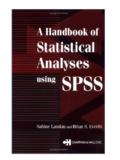
Transcription of First published 2012 by Psychology Press - Amazon Web …
1 First published 2012 by Psychology Press 27 Church Road, Hove, East Sussex BN3 2FA Simultaneously published in the USA and Canada by Psychology Press , 711 Third Avenue, New York NY 10017 Psychology Press is an imprint of the Taylor & Francis Group, an informa business Copyright 2012 Psychology Press Printed and bound in Great Britain by TJ International Ltd, Padstow, Cornwall, from pdf files supplied by the authors. Cover design by Hybert Design. All rights reserved. No part of this book may be reprinted or reproduced or utilised in any form or by any electronic, mechanical, or other means, now known or hereafter invented, including photocopying and recording, or in any information storage or retrieval system, without permission in writing from the publishers.
2 This book is not sponsored or approved by spss , and any errors are in no way the responsibility of spss . spss is a registered trademark and the other product names are trademarks of spss Inc. spss Screen Images spss Inc. spss UK Ltd, First Floor St Andrew s House, West Street, Woking, Surrey, GU21 1EB, UK. Windows is a registered trademark of Microsoft Corporation. For further information, contact: Microsoft Corporation, One Microsoft Way, Redmond, WA 98052-6399, USA. This publication has been produced with paper manufactured to strict environmental standards and with pulp derived from sustainable forests.
3 British Library Cataloguing in Publication Data A catalogue record for this book is available from the British Library. Library of Congress Cataloging-in-Publication Data Gray, Colin D. ibm spss statistics 19 made simple / Colin D. Gray and Paul R. Kinnear. p. cm. Includes bibliographical references and index. ISBN 978-1-84872-069-5 (soft cover) 1. spss (Computer file) 2. Social sciences--Statistical methods--Computer programs. I. Kinnear, Paul R. II. Title. 2012 '5--dc23 2011025014 ISBN: 978-1-84872-069-5 (pbk only) iii Contents Preface xiii CHAPTER 1 INTRODUCTION 1 AIMS AND OBJECTIVES 1 MEASUREMENTS AND DATA 2 Variables: quantitative and qualitative 2 Levels of measurement.
4 Scale, ordinal and nominal data 2 Univariate, bivariate and multivariate data sets 3 DISTRIBUTIONS 4 The three most important properties of a distribution 5 Some common distribution shapes 6 EXPERIMENTAL VERSUS CORRELATIONAL RESEARCH 7 A simple experiment 8 A more complex experiment 9 A correlational study 10 Quasi-experiments 13 CHOOSING A STATISTICAL TEST 13 Considerations in choosing a statistical test 13 Five common research situations 14 A SIGNIFICANT DIFFERENCE?
5 15 Independent or related samples? 15 Flow chart 16 ARE TWO VARIABLES ASSOCIATED? 17 Flow chart 18 Measuring association in ordinal data 18 Measuring association in nominal data: contingency tables 19 Multi-way contingency tables 20 MAKING PREDICTIONS 20 Flow chart 20 Simple regression 21 Multiple regression 21 Predicting category membership 22 FROM A SINGLE SAMPLE TO THE POPULATION 22 Flow chart 22 Goodness-of-fit.
6 Nominal data 23 Inferences about the mean of a single population 23 THE SEARCH FOR LATENT VARIABLES 24 MULTIVARIATE STATISTICS 24 Contents A FINAL WORD 25 CHAPTER 2 Getting started with ibm spss Statistics 19 26 INTRODUCTION 26 DESCRIBING THE DATA FROM THE CAFFEINE EXPERIMENT 29 Opening spss 29 The spss Statistics Data Editor 30 Working in Variable View 30 Working in Data View 35 Computing the group means 39 The spss Statistics Viewer 42 The output from the Means procedure 46 Histograms 47 Editing items in the Viewer 52 Ending the session 53 Resuming work on a saved data set 53 THE FOUR DRUGS EXPERIMENT 53 In Variable View 54 In Data View 56 Using the Means procedure 57 The histograms 59 PRINTING FROM THE STATISTICS VIEWER 60 USING spss SYNTAX 64 The
7 Syntax Editor 65 Running the Means procedure with Syntax 66 Looping functions in Syntax 69 A FINAL WORD 69 CHAPTER 3 Editing data sets 70 MORE ON THE DATA EDITOR 70 A preliminary check on the default settings 70 Inserting new variables 71 Rearranging the order of variables in the Data Editor 72 Inserting case numbers 73 Using Syntax to insert case numbers into a data set 76 Inserting case numbers into an empty Data Editor 76 Using Syntax to insert case numbers into an empty Data Editor 77 Changing the default settings for Width and Decimals 77 String variables 78 Specifying missing values 80 Changing the Alignment settings 82 Opening an spss file 82 Entering data from other applications 83 Creating new variables while in DataView 84 Adding new cases while in Data View 85 VALIDATION OF THE DATA 85
8 V Validation of the data by defining rules 85 Handling multiple duplications in a large data set 91 EDITING ITEMS IN THE VIEWER 92 Changing the format of a table 92 Widening, narrowing and hiding columns in a Report table 94 Deleting rows and columns from a Report table 95 Editing the captions in a table 96 Changing the number of decimal places displayed in a table 97 SELECTING CASES 97 AGGREGATING DATA 99 SORTING DATA 101 FILE-MERGING: ADDING CASES 103 FILE-MERGING: ADDING VARIABLES 105 THE COMPUTE VARIABLE COMMAND 108 Calculating functions of several variables 108 Conditional transformations 109 THE RECODE COMMAND 112 A FINAL WORD 115 CHAPTER 4 Describing and exploring your data 117 INTRODUCTION 117 DESCRIBING NOMINAL DATA 119 Describing nominal data on one attribute 119 Two attributes.
9 Contingency tables 121 DESCRIBING CONTINUOUS OR SCALE DATA 130 Histograms of height and weight for males and females 131 Obtaining scatterplots of weight against height 132 Statistics of height in males and females 135 DESCRIBING SMALL DATA SETS 137 The stem-and-leaf display and the boxplot 138 Exploring a small data set 142 Some of the statistical output from Explore 143 DESCRIBING DATA FROM MULTIPLE RESPONSE QUESTIONNAIRES 145 Data for the Multiple Response procedure 147 Creating a multiple response set 148 Obtaining the crosstabulations 150 Finding the frequencies of specific transport profiles 155 A FINAL WORD 159 CHAPTER 5 More on graphs and charts 161 INTRODUCTION 161 BAR CHARTS 162 Simple bar charts 162 Clustered bar charts 163 Panelled bar charts 166
10 Contents Editing a bar chart 167 ERROR BAR CHARTS 171 BOXPLOTS 173 PIE CHARTS 173 LINE GRAPHS 174 The Visual Binning procedure 175 Plotting line graphs 177 USING CHART TEMPLATES 179 A FINAL WORD 183 CHAPTER 6 Comparing averages: Two-sample and one-sample tests 184 OVERVIEW 184 THE INDEPENDENT-SAMPLES T TEST WITH spss 185 Running the t test 185


