Transcription of Five-Year Yields and Spreads Look Attractive
1 Balance Sheet Solutions, LLC is a Securities and Exchange Commission (SEC)-registered investment advisor. Broker-dealer transactions are facilitated through ISI, member FINRA/SIPC. Back to Basics Rolling Down the Curve By Tom Slefinger, Senior Vice President, Director of Institutional Fixed Income Sales at Balance Sheet Solutions, LLC. Tom can be reached at One of the easiest and time-tested strategies for making money investing in bonds is called rolling down the yield curve. As long as shorter-term bonds yield less than longer-term bonds, this strategy is effective.
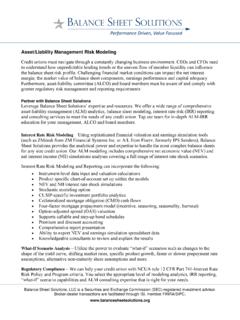
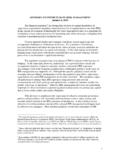
2 Rolling down the yield curve can significantly enhance returns versus buying a shorter-maturity security, or staying in overnight funds. What is Roll Down? Simply put, as a bond ages toward maturity, each year it produces lower Yields thus, rolling down the curve. As its yield falls, the value of the bond rises. The Timing is Right Since May, Yields have risen and the Treasury yield curve has steepened significantly. Meahwhile, short-term cash equivalents are yielding historic lows near 0%. The following graph shows that the yield on the Five-Year Treasury has risen by 100 bps (from to ) since early May.
3 As Yields have risen, the yield curve has steepened with the spread between the two-year Treasury and the Five-Year Treasury widening from 44 bps to 136 bps as the time of this writing (January 2014), the highest level since 2011. Thus, the combination of extremely low Yields on overnight funds, coupled with the recent steepening of the yield curve, creates an Attractive opportunity to extend and roll down the curve. Five-Year Yields and Spreads Look Attractive Balance Sheet Solutions, LLC is a Securities and Exchange Commission (SEC)-registered investment advisor.
4 Broker-dealer transactions are facilitated through ISI, member FINRA/SIPC. How Do You Know What Bonds to Buy? The yield curve is not a straight line with yield decreasing evenly over time. When selecting bonds to implement a rolling down the curve strategy, attempt to locate bonds in the steepest areas of the yield curve. To over-simplify, you want the biggest change in yield over the shortest amount of time. Currently, the yield curve provides opportunities in both short and intermediate maturities, with the short end providing a unique opportunity to implement this strategy.
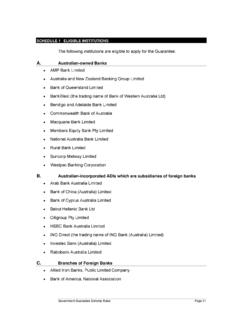
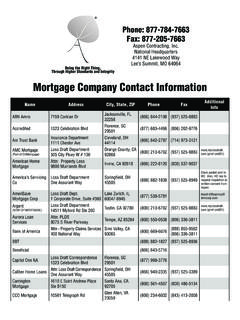
5 The next graph depicts opportunity Five-Year maturities for this strategy. Under this scenario, a Five-Year Treasury, held for 24-months, would appreciate in price as the bond rolls down towards a lower portion of the yield curve (in this case from to ). In essence, a the Five-Year bond will appreciate in value as Yields decline. This is due to the passage of time, thereby providing a cushion in the form of a higher total return. Take a Ride on the Yield Curve An Example of Rolling Down the Curve The following chart plots the total return of a Five-Year Agency bullet, over a two-year time horizon, under varying interest rate scenarios: ranging from -100 to +300 bps.
6 In an unchanged rate/curve scenario, the total return (income, price and roll-down) of a Five-Year Agency, over a 24-month time horizon, would be The income return of represents 58% of the total return. The difference between the income return and total return is attributable to the roll-down effect. In fact, the roll down amounts to , or 42% of the total return (see yellow-highlighted are). This is the power of rolling down the curve! The roll-down strategy may also help protect principal in a rising interest-rate environment. As highlighted in red in the following Agency chart, even if rates rise 100 bps from current levels, the total return on the Five-Year Agency would be It would produce an income return of and a price decline of However, once again, the roll-down return of + mitigates much of the price decline.
7 Balance Sheet Solutions, LLC is a Securities and Exchange Commission (SEC)-registered investment advisor. Broker-dealer transactions are facilitated through ISI, member FINRA/SIPC. What Could Go Wrong? This strategy works best when the yield curve remains upward sloping, and rates remain the same (or rise less than the markets are predicting). Conversely, if Yields rise by the full amount the markets predict, the benefits of this strategy could be zero. Also keep in mind that the longer the maturity of the bond, the smaller the increase in interest rates needed to turn the rolling down the yield curve strategy into a losing investment.
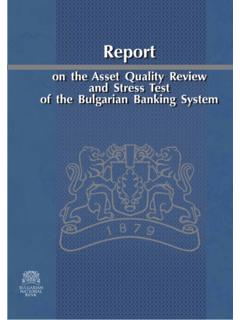
8 As shown in the next chart, if rates rise in excess of 200 bps over the next 24 months, the Five-Year bullet will show a negative total return. Five-Year Agency Total Return Analysis, 24-Months Aged Issuer Name Coupon Maturity Price YTW Scenario Income Price Roll Total Return Ending Eff Dur Ending Price FNMA 02/19/2019 NO CHANGE Summary On numerous occasions, the Fed has stated its intention to leave short-term interest rates unchanged until 2015, at the earliest.
9 With inflation declining well below what the Fed finds acceptable, it is conceivable that the Fed could leave the Fed Funds rate unchanged through 2016 if not beyond. So while the easy money from the 30-year secular bull market has been made, staying in cash still remains an unattractive strategy. In the context of the economic backdrop and the conviction that the Fed will remain on hold for quite some time, we believe that the front end of the yield curve is providing an Attractive opportunity for credit unions to enhance income. As we discussed in the latest WRV, given the slope of the curve we believe 5 year agency bullets offer the best combination of yield and roll down.
10 In the short duration space we feel that this may be one of the best risk-return strategies for credit unions in the market today. More Information For more information about credit union investment strategy, portfolio allocation and security selection, please contact the author at or 800-782-2431, ext. 2753. Tom Slefinger, Senior Vice President, Director of Institutional Fixed Income Sales, and Registered Representative of ISI, has more than 30 years of fixed income portfolio management experience. He has developed and successfully managed various high profile domestic and global fixed income mutual Balance Sheet Solutions, LLC is a Securities and Exchange Commission (SEC)-registered investment advisor.