Transcription of FIXED INCOME - Research Affiliates
1 FIXED INCOMEM ethodology OverviewTABLE OF CONTENTSOVERVIEW ..1 What is This Document? ..1 Time Horizon ..2 FIXED INCOME ..3 Asset Class Overview ..3 Expected Return Methodology ..5 Yield ..5 Roll Return ..11 Credit Loss ..12 Valuation Change ..13 Results ..14 REFERENCES ..15 REVISION DATE: 10/01/2014 FIXED INCOME | 1 OVERVIEWWhat is This Document?This is one in a series of plain-language white papers setting forth Research Affiliates building block approach to developing long-term capital market expectations by asset class. (For information about the objectives and guiding principles of our asset allocation initiative, please refer to Capital Market Expectations: Methodology Overview, the first of these white papers.)
2 In working out our risk and return forecasts and making them publicly available, we keep three criteria in mind: transparency, robustness, and timeliness. By describing the conceptual framework and calculations behind the projected asset class risks, returns, and correlations in these papers, we hope to achieve a meaningful level of transparency without excessive details. By constructing simple, economically sound models for major asset classes, we strive to achieve a fitting standard of robustness for forecasting to a 10-year horizon. By initially refreshing our expectations on a quarterly basis, we seek to provide information that is updated with useful frequency.
3 We will continue to refine our methods, extend the scope of our capital market expectations, and improve this documentation over remainder of this document addresses how we think about FIXED INCOME asset class returns from a building block perspective, and provides transparency into the methods employed to develop these return expectations. We understand that some of our insights will never find their way into products, but we provide them in support of investors and the finance community. ROB ARNOTTCHAIRMAN & CEO2 | FIXED INCOMETime HorizonOne of the major considerations when embarking on the journey to generate asset class return expectations is the issue of time horizon.
4 Because the focus here is on generating capital market expectations for strategic asset allocation, and not tactical overlays, a significantly long time horizon of 10 years was 10-year time horizon is not meant to imply a 10-year buy-and-hold strategy, but instead incorporates a strategy consisting of asset classes with constant duration targets. Said another way, asset classes with shorter durations ( , FIXED INCOME ) need to be periodically rebalanced to maintain the constant duration. The rebalance period chosen here is one year which means that a two-year bond, for example, will be held for one year, at which time the bond with one year remaining to maturity would be sold and the proceeds are used to purchase a new two-year bond.
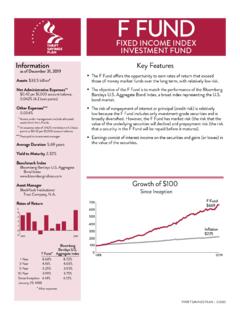
5 Asset classes with significantly long duration ( , equities) can be considered buy-and-hold because the change in duration from the passage of 1, 2, or even 10 years on these types of assets is INCOME | 3 FIXED IncomeAsset Class OverviewFixed INCOME securities, also known as debt instruments, represent one of the major ways that entities, such as governments and corporations, raise capital. Since 1980, the FIXED INCOME landscape has grown in size and complexity. Figure 1 shows that total debt outstanding expanded almost sixfold in the past 35 years in real terms (Securities Industry and Financial Markets Association, ).
6 $0$5,000$10,000$15,000$20,000$25,000$30, 000$35,000$40,000$45,0001980198319861989 19921995199820012004200720102013 OUTSTANDING DEBT AMOUNT (REAL 2014 BILLIONS USD)MUNICIPALTREASURYRELATEDDEBTSECURITI ESMONEY MARKETSASSET-BACKEDS ource: Research Affiliates , based on data from SIFMA FIXED INCOME indices come in all shapes, sizes, and flavors; however, from an asset allocation perspective, we are most interested in categorizing issues based on their risk dimensions, such as duration, credit quality, and geography. For example, when looking at a market, it s important to be able to price securities of all maturities, credit quality bands ( , sovereign, investment-grade, and high-yield debt), and geographies (countries and regions).
7 FIGURE 1 Growth in Real 2014 USD Total Debt Outstandingby Instrument Type4 | FIXED INCOMEThe abundance of FIXED INCOME indices and vehicles allows investors to isolate the factors where exposure is desired. Table 1 shows a sample of FIXED INCOME asset classes and examples of representative indices. This is by no means the entire universe of FIXED INCOME asset classes, nor are these representative indices the only ones that describe these asset ClassRepresentative IndexShort Term TreasuriesBarclays Treasury 1-3 Year IndexIntermediate Term TreasuriesBarclays Treasury Intermediate IndexLong-Term TreasuriesBarclays Treasury Long Intermediate Investment-Grade Corporate BondsBarclays Intermediate Corporates Long Term Investment-Grade Corporate BondsBarclays Long Corporates High-Yield DebtBarclays Corporate High Yield IndexTIPSB arclays TIPS IndexLong TIPSB arclays Inflation 10+ Year Core BondsBarclays Aggregate IndexGlobal
8 Core BondsBarclays Global Aggregate IndexAll Country Core BondsBarclays Global AggregateEmerging Market (Hard Currency) BondsJP Morgan EMBI+ IndexEmerging Market (Local Currency) BondsJP Morgan GBI-EM IndexSource: Research AffiliatesSome of the indices listed in Table 1, such as the Barclays Aggregate and Global Aggregate Indices, are composed of other indices. To maintain consistency, these indices are modeled as weighted averages of the underlying constituent indices that comprise the aggregate. Similarly, indices that contain debt instruments from a variety of countries, such as the JP Morgan GBI-EM Index, are modeled country by country, and the total expected return of the index is calculated as a weighted average based on the mix of countries in the 1 Sample FIXED INCOME Asset Classes and Representative IndicesFIXED INCOME | 5 Expected Return MethodologyThe model for forecasting FIXED INCOME returns is adapted from a model detailed by Antti Ilmanen (1995), and incorporates five components.
9 Yield, roll return, credit loss, change in interest rates and spreads, and currency adjustment. The currency adjustment is included to address instances where the asset class is denominated in a currency other than the investor s currency of choice. The currency adjustment is included in the equation below for completeness; however, details on the calculation and methodology of the currency adjustment are left to Domestic & Foreign Cash Methodology Overview, another white paper in this model is similar to the component framework used for the other asset classes. Yield is the average cash flow per unit of investment expected to be received in the future by an Because cash flows are generally FIXED for the life of a bond,2 there is no explicit growth component.
10 Instead, we include a component for roll return, which captures the fact that the price and yield of a debt security with FIXED cash flows will change based on the passage of time and the shape of the yield curve. Credit losses reflect the fact that, due to a borrower s ineffectiveness in paying debts, investors may never receive the cash flows they are owed on an investment. Thoughtful investors must therefore expect a percentage loss on all debt investments. This loss is often forecasted based on the credit quality of the borrower. Finally, as time passes, interest rates and interest rate spreads will move.