Transcription of Florida’s June Employment Figures Released
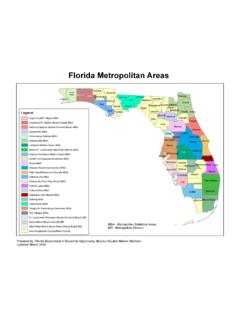
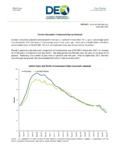
1 Rick Scott Cissy Proctor GOVERNOR EXECUTIVE DIRECTOR. CONTACT: Labor Market Statistics (850) 245-7205. Florida's December Employment Figures Released Florida's seasonally adjusted unemployment rate was percent in December 2017, up percentage point from November 2017, but down percentage points from a year ago. There were 374,000 jobless Floridians out of a labor force of 10,127,000. The unemployment rate was percent in December. Florida's seasonally adjusted total nonagricultural Employment was 8,705,900 in December 2017, an increase of 27,400 jobs (+ percent) over the month. The state gained 213,500 jobs over the year, an increase of percent. Nationally, the number of jobs rose percent over the year. Prior to September 2017, Florida's over-the-year job growth rate had exceeded the nation's rate since May 2012. United States and Florida Unemployment Rates (seasonally adjusted).
2 12. Florida United States 10. 8. Percent 6. 4. 2. 0. Dec-13. Dec-07. Jun-08. Dec-08. Jun-09. Dec-09. Jun-10. Dec-10. Jun-11. Dec-11. Jun-12. Dec-12. Jun-13. Jun-14. Dec-14. Jun-15. Dec-15. Jun-16. Dec-16. Jun-17. Dec-17. Source: Department of Labor, Bureau of Labor Statistics, Local Area Unemployment Statistics Program, in cooperation with the Florida Department of Economic Opportunity, Bureau of Labor Market Statistics. Florida's Nonagricultural Employment by Industry (Seasonally Adjusted). The number of jobs in Florida was 8,705,900 in December 2017, up 213,500 jobs compared to a year ago. December 2017 was the 89th consecutive month with positive over-the-year job growth. The industry gaining the most jobs was professional and business services (+47,200 jobs, + percent). Other industries gaining jobs over the year included construction (+43,900 jobs, + percent); trade, transportation, and utilities (+33,600 jobs, + percent); education and health services (+22,300 jobs, + percent); manufacturing (+16,200 jobs, + percent); financial activities (+15,300 jobs, + percent); other services (+14,900 jobs, + percent); leisure and hospitality (+9,100 jobs, + percent); government (+8,800.)
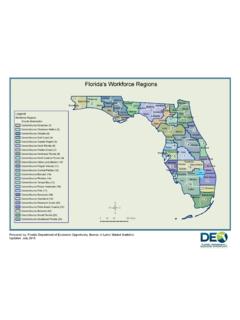
3 Jobs, + percent); and information (+2,200 jobs, + percent). Local Area Unemployment Statistics (Not Seasonally Adjusted). In December 2017, St. Johns County had the state's lowest unemployment rate ( percent); followed by Monroe, Okaloosa, and Wakulla counties ( percent each); and Orange and Seminole counties ( percent each). Hendry County had the highest unemployment rate ( percent) in Florida in December 2017, followed by Hardee County ( percent); and Citrus County ( percent). Area Nonagricultural Employment (Not Seasonally Adjusted). In December 2017, 23 out of 24 metro areas in Florida had over-the-year job gains. The areas with the largest gains were Orlando-Kissimmee-Sanford (+46,700 jobs, + percent); Miami-Miami Beach-Kendall (+35,000. jobs, + percent); and Tampa-St. Petersburg-Clearwater (+29,100 jobs, + percent). The only metro area losing jobs over the year was Homosassa Springs (-100 jobs, percent).
4 The unemployment and job growth rates are estimates, which are primarily based on surveys created and mandated by the Bureau of Labor Statistics in cooperation with the Florida Department of Economic Opportunity. The unemployment rate is derived from Florida household surveys conducted by the Census Bureau under contract with the Bureau of Labor Statistics. The job growth rate is derived from Florida employer surveys conducted by the Bureau of Labor Statistics. Both estimates are revised on a monthly basis. In addition, these estimates are benchmarked (revised) annually based on actual counts from Florida's Reemployment Assistance tax records and other data. Procedures mandated by the Bureau of Labor Statistics may result in more variable month-to-month changes. For further information, go to: The mission of the Florida Department of Economic Opportunity is to promote economic prosperity for all Floridians and businesses through successful workforce, community, and economic development strategies.
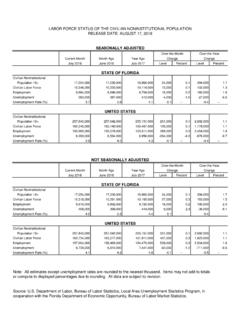
5 Please visit for more information. The next Florida Employment and Unemployment release will be March 12, 2018, at 10:00 2. LABOR FORCE STATUS OF THE CIVILIAN NONINSTITUTIONAL POPULATION. RELEASE DATE: January 19, 2018. SEASONALLY ADJUSTED. Over-the-Month Over-the-Year Current Month Month Ago Year Ago Change Change December 2017 November 2017 December 2016 Level Percent Level Percent STATE OF FLORIDA. Civilian Noninstitutional Population 16+ 17,070,000 17,045,000 16,763,000 25,000 307,000 Civilian Labor Force 10,127,000 10,124,000 9,942,000 3,000 * 185,000 Employment 9,753,000 9,754,000 9,450,000 -1,000 * 303,000 Unemployment 374,000 369,000 492,000 5,000 -118,000 Unemployment Rate (%) -- -- UNITED STATES. Civilian Noninstitutional Population 16+ 256,109,000 255,949,000 254,742,000 160,000 1,367,000 Civilian Labor Force 160,597,000 160,533,000 159,736,000 64,000 * 861,000 Employment 154,021,000 153,917,000 152,233,000 104,000 1,788,000 Unemployment 6,576,000 6,616,000 7,502,000 -40,000 -926,000 Unemployment Rate (%) -- -- NOT SEASONALLY ADJUSTED.
6 Over-the-Month Over-the-Year Current Month Month Ago Year Ago Change Change December 2017 November 2017 December 2016 Level Percent Level Percent STATE OF FLORIDA. Civilian Noninstitutional Population 16+ 17,070,000 17,045,000 16,763,000 25,000 307,000 Civilian Labor Force 10,063,000 10,082,000 9,910,000 -19,000 153,000 Employment 9,694,000 9,695,000 9,442,000 -1,000 * 252,000 Unemployment 368,000 388,000 467,000 -20,000 -99,000 Unemployment Rate (%) -- -- UNITED STATES. Civilian Noninstitutional Population 16+ 256,109,000 255,949,000 254,540,000 160,000 1,569,000 Civilian Labor Force 159,880,000 160,466,000 159,451,000 -586,000 429,000 Employment 153,602,000 154,180,000 152,385,000 -578,000 1,217,000 Unemployment 6,278,000 6,286,000 7,066,000 -8,000 -788,000 Unemployment Rate (%) -- -- * = less than percent Note: All estimates except unemployment rates are rounded to the nearest thousand.
7 Items may not add to totals or compute to displayed percentages due to rounding. All data are subject to revision. Source: Department of Labor, Bureau of Labor Statistics, Local Area Unemployment Statistics Program, in cooperation with the Florida Department of Economic Opportunity, Bureau of Labor Market Statistics. 3. Nonagricultural Employment in Florida Seasonally Adjusted Over-the-Month Over-the-Year December p November r December Change Change 2017 2017 2016 Level Percent Level Percent Total Nonagricultural Employment 8,705,900 8,678,500 8,492,400 27,400 213,500 Total Private 7,597,000 7,567,300 7,392,300 29,700 204,700 Goods Producing 908,000 901,900 847,900 6,100 60,100 Mining, Logging, and Construction 534,100 529,500 490,200 4,600 43,900 Construction 528,400 523,800 484,500 4,600 43,900 Manufacturing 373,900 372,400 357,700 1,500 16,200 Durable Goods 258,000 256,700 243,700 1,300 14,300 Nondurable Goods 115,900 115,700 114,000 200 1,900 Service Producing 7,797,900 7,776,600 7,644,500 21,300 153,400 Private Service Providing 6,689,000 6,665,400 6,544,400 23,600 144,600 Trade, Transportation, and Utilities 1,771,400 1,768,700 1,737,800 2,700 33,600 Wholesale Trade 353.
8 800 353,300 337,300 500 16,500 Retail Trade 1,127,500 1,127,100 1,118,100 400 * 9,400 Transportation, Warehousing, and Utilities 290,100 288,300 282,400 1,800 7,700 Information 140,100 141,500 137,900 -1,400 2,200 Financial Activities 568,300 566,300 553,000 2,000 15,300 Finance and Insurance 374,200 374,200 371,100 0 3,100 Real Estate, Rental, and Leasing 194,100 192,100 181,900 2,000 12,200 Professional and Business Services 1,350,200 1,340,900 1,303,000 9,300 47,200 Professional and Technical Services 555,300 555,400 533,500 -100 * 21,800 Management of Companies and Enterprises 105,700 105,100 102,900 600 2,800 Administrative and Waste Services 689,200 680,400 666,600 8,800 22,600 Education and Health Services 1,285,000 1,279,300 1,262,700 5,700 22,300 Educational Services 160,400 160,200 159,900 200 500 Health Care and Social Assistance 1,124,600 1,119,100 1,102,800 5,500 21,800 Leisure and Hospitality 1,203,100 1,199,100 1,194,000 4,000 9,100 Arts, Entertainment, and Recreation 226,700 221,900 223,500 4,800 3,200 Accommodation and Food Services 976,400 977,200 970,500 -800 5,900 Other Services 370,900 369,600 356,000 1,300 14,900 Source: Department of Labor, Bureau of Labor Statistics, Current Employment Statistics Program.
9 Prepared by: Florida Department of Economic Opportunity, Bureau of Labor Market Statistics. 4. Nonagricultural Employment in Florida Seasonally Adjusted Over-the-Month Over-the-Year December p November r December Change Change 2017 2017 2016 Level Percent Level Percent Total Government 1,108,900 1,111,200 1,100,100 -2,300 8,800 Federal Government 138,700 139,100 140,000 -400 -1,300 State Government 212,200 212,300 212,800 -100 * -600 Local Government 758,000 759,800 747,300 -1,800 10,700 Released : Friday, January 19, 2018. p = preliminary, r = revised * = less than percent Note: Sum of detail may not equal totals due to rounding or the exclusion of certain industries from publication. All data are subject to revision. Source: Department of Labor, Bureau of Labor Statistics, Current Employment Statistics Program. Prepared by: Florida Department of Economic Opportunity, Bureau of Labor Market Statistics.
10 5. NONAGRICULTURAL Employment IN FLORIDA. STATEWIDE (Not Seasonally Adjusted). Released January 19, 2018. Change from December November December Nov 2017 to Dec 2017 Dec 2016 to Dec 2017. Industry Title 2017 2017 2016 Level Percent Level Percent Total Nonagricultural Employment 8,801,900 8,761,200 8,581,400 40,700 220,500 Total Private 7,676,000 7,627,900 7,466,300 48,100 209,700 Goods Producing 913,100 909,400 852,600 3,700 60,500 Mining and Logging 5,700 5,700 5,700 0 0 Mining, except Oil and Gas 3,400 3,400 3,400 0 0 Mining, Logging, and Construction 537,400 535,700 492,900 1,700 44,500 Construction 531,700 530,000 487,200 1,700 44,500 Construction of Buildings 103,600 103,600 94,300 0 9,300 Heavy and Civil Engineering Construction 63,000 63,100 60,100 100 2,900 Specialty Trade Contractors 365,100 363,300 332,800 1,800 32,300 Building Equipment Contractors 156,900 157,500 146,100 600 10,800 Manufacturing 375,700 373,700 359,700 2,000 16,000 Durable Goods 259,200 257,600 244,800 1,600 14,400 Fabricated Metal Product Manufacturing 43,000 41.