Transcription of Food Dyes and Beer’s Law - Thermo Fisher Scientific
1 LESSON PLAN SPECTRONIC 200 Visible Spectrophotometer Food Dyes and Beer's Law FL53099. What makes your drink blue? Introduction The color of light White light, as we see it, is a mixture of all the colors of the spectrum. We are used to seeing raindrops scatter white light into its colors to form a rainbow, or seeing rainbows . of light on a wall from sunlight that has been scattered by cut glass or a prism. If you perceive an object as being colored, as opposed to white, it is because colors other than the one you see are being absorbed by the object. For chemical solutions, we can use an instrument called a spectrophotometer to pass light through the solution and measure which wavelengths are absorbed. You can predict what wavelengths will be absorbed at a simple level by taking the visible spectrum and wrapping it into a circle to e make a spectroscopist's color w ng en et llo ue d ol ra re Re Ye Bl Vi wheel.
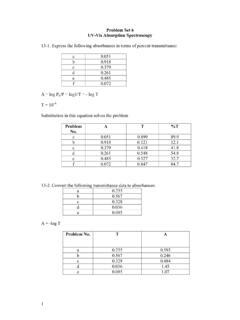
2 With this wheel, the color G. O. that you see is the opposite of the color that is absorbed. If you know what wavelengths of the 380. 590. 450. 495. 620. 750. 570. visible spectrum correspond to which color, you can predict Wavelength (nm). where in the spectrum a Figure 2. Visible spectrum chemical will absorb even Figure 1. Color wheel before doing the experiment. UV-Visible spectrophotometers Measuring how much of which wavelengths of light are The wavelength of light is measured in nanometers: 1 nm absorbed by a substance, and getting useful information is 1 x 10 -9 meters. The visible spectrum in Figure 2 shows about that substance from the results, is the Scientific which wavelengths correspond to which color of light. discipline of spectroscopy. The visible spectrum is one part of the electromagnetic spectrum that we can access Percent transmittance (%T), which is a linear scale with equipment found in a typical chemistry laboratory.
3 The Absorbance (A), which is a logarithmic scale basic principles of spectrum analysis can also be applied to other instrumentation that examine the ultraviolet, The linear %T scale can be converted to absorbance where infrared, and radio frequency regions. T is the percent transmittance expressed as a decimal ( , 22% = ): In a visible spectrophotometer, we shine a beam of light into a solution containing the sample, and detect how A = Log10 T. much of it comes out of the other side of the solution. By comparing the amount of light transmitted by the pure The most important lesson to take home from this solvent to the amount transmitted when the sample is logarithmic relationship is the realization that when the dissolved in it, we can calculate a quantity called the absorbance is , only 10% of the light beam 's full intensity absorbance.
4 Absorbance is directly proportional to is reaching the detector and when the absorbance is , concentration, so if you know the proportionality constant, only 1% of the light beam is reaching the detector. The you can use it to calculate the concentration of a substance accuracy and sensitivity of low cost instruments starts to in solution. Being able to answer the how much? question suffer at absorbance values higher than means that a visible spectrophotometer is a tool for doing quantitative analysis. Transmittance (or %T) itself is determined by the instrument by dividing the detector signal when measuring the sample Knowing exactly which wavelengths of light are absorbed (I) by the signal recorded for a blank solution (I0). by a substance also gives us information that can be used to tell one substance from another or to determine I.
5 T= Transmittance whether a sample is a pure substance or a mixture. I0. Being able to answer the what is it? question means that a visible spectrophotometer is also a tool for doing When we work with cuvettes or test tubes where the qualitative analysis. path through the liquid is exactly 1 cm, the value of b in the equation for Beer's Law is simply 1, so it effectively Absorbance and Beer's Law drops out of the equation and simplifies it to A = c. This When colored solutions are irradiated with white means that: light, the solution selectively absorbs incident light of If you were to measure the absorbance of several some wavelengths. The wavelength of light where the solutions of known concentration, and plot the absorbance is highest is used as the analytical wavelength. absorbance on the y-axis and concentration on the Once the analytical wavelength for a particular solution x-axis, the slope would be the molar absorptivity ( ) of is determined, we can learn more about the solution the sample in solution.
6 Through the relationship between absorbance (A) and three variables: If you know the molar absorptivity, you can calculate the concentration (c) of a solution with ease by simply A = bc Beer's Law dividing the absorbance by (c = A/ ). The three variables are concentration of the solution (c), Purpose the pathlength of the light through the solution (b), and In this experiment, you will make different kinds of the sensitivity of the absorbing species to the energy measurement on various food dyes: of the analytical wavelength. When the concentration is expressed in molarity and the path length is measured in 1. A scan of the visible spectrum recorded using a centimeters, the sensitivity factor is known as the molar Thermo Scientific SPECTRONIC 200 Visible (Vis). absorptivity ( ) of the particular absorbing species. Spectrophotometer* will show you which wavelengths are absorbed by each sample.
7 You will identify a peak Visible spectrophotometers are capable of displaying data or peaks in the scan and record the wavelength of each in either of two scales: peak. Officially, the wavelength at the top of the peak is called the wavelength of maximum absorbance , which ensure consistent placement into the instrument. is abbreviated to max (spoken as lambda max ). 2. Add liquid to the cuvette until there is ~3 cm of liquid 2. A single point measurement recorded at max will be in the bottom (4 cm for test tubes). If plastic transfer used to calculate the concentration of red, yellow, green, pipettes are available, use one. The exact liquid level and blue food dyes in a solution. You will be able to in the cuvette is not critical for good measurements as determine which chemical dye was used in the solution long as it is above 3 cm.
8 Do not waste solution or risk samples and whether the dye is a single chemical food spills by over-filling the cuvette. dye or a mixture of dyes. 3. Place the cuvette in the sample stage of the 3. Given a stock solution of known concentration, you will SPECTRONIC 200 Visible Spectrophotometer. If using make a Beer's Law plot by diluting the solution. You a plastic cuvette, the clear sides should be on the right will then take a sports drink or soft drink and determine and left. If using a test tube cuvette, place it so that the the molar concentration of the Blue No. 1 dye found mark faces to the right. in it. From this calculation and the molar mass of your 4. After the warm-up period, follow steps 2 and 3 using dye, you will determine the mass of Blue No. 1 dye water or the appropriate blank solvent. Zero the found in 591 mL of the solution equivalent to a 20 fluid instrument by pressing the autozero button.
9 Ounce bottle. Experimental 5. For each subsequent measurement, empty and rinse your cuvette, shaking out as much of the rinse solvent as possible. When preparing samples, never return Procedure excess solution to the stock bottle. Pour all waste or Making a measurement with the Thermo Scientific . excess into the appropriate waste receptacle. Follow SPECTRONIC 200 Visible (Vis) Spectrophotometer*. steps 2 and 3 using your sample. 1. Turn on the instrument and allow it to complete its startup sequence. Let the instrument warm up and Part 1. Scan the dyes stabilize for at least 30 minutes. Set up the experiment Prior to the lab, your instructor should have prepared dye you want to perform in the spectrophotometer software. solutions using the four packs of liquid food dyes from Obtain a square plastic cuvette or glass test tube to use McCormick Food Coloring containing red, yellow, blue in your experiments.
10 If using a test tube cuvette, use a and green dyes [1]. The actual concentration of the dye pen to place a mark near the top if the cuvette is not solutions is arbitrary, but they should be chosen to ensure already marked with a white line. The mark allows you to the largest peak in each solution lies within the absorbance range of the spectrophotometer. 1. Run a scan of each dye solution from 400 nm to 700 nm. 2. Record the wavelength ( max) and absorbance at each peak in the spectrum. If the color is due to a mixture of dyes, two max peaks will be present. 3. Enter this information in Data Table 1 in the Lab Report. Data analysis: Determination of the dyes used in McCormick food coloring SPECTRONIC 200 Visible Spectrophotometer Use the reference spectra in the Appendix to determine *SPECTRONIC 200 spectrophotometers are available which chemical dye(s) are used to make each of the four on loan from Thermo Fisher Scientific at no cost.