Transcription of Food O utlook - Food and Agriculture Organization
1 food outlook BIANNUAL REPORT ON GLOBAL food MARKETS. June 2017. ACKNOWLEDGEMENTS. T he food outlook report is a product of the FAO Trade and Markets Division. This report is prepared under the overall guidance of Boubaker Ben-Belhassen, Director, and Abdolreza Abbassian, Senior Economist. It is written by a team of economists, whose names and email contacts appear under their respective market summary contributions. The report benefited from research support by many staff, namely, David Bedford, Julie Claro, Anna Maria Giusti, Grace Karumathy, Lavinia Lucarelli, David Mancini, Emanuele Marocco, Marco Milo, Di Yang and the fisheries statistical team. Special thanks go to Stanislaw Czaplicki and David Bedford for preparing the charts and statistical tables and to Valentina Banti for her administrative support. Additionally, the team is grateful to Rita Ashton for the desktop publishing and to Nancy Hart for her valuable editorial assistance. The designations employed and the presentation of material in this information product do not imply the expression of any opinion whatsoever on the part of the food and Agriculture Organization of the United Nations (FAO) concerning the legal or development status of any country, territory, city or area or of its authorities, or concerning the delimitation of its frontiers or boundaries.
2 The mention of specific companies or products of manufacturers, whether or not these have been patented, does not imply that these have been endorsed or recommended by FAO in preference to others of a similar nature that are not mentioned. ISSN 0251-1959 (print). ISSN 1560-8182 (Online). ISBN 978-92-5-109782-3. FAO, 2017. FAO encourages the use, reproduction and dissemination of material in this information product. Except where otherwise indicated, material may be copied, downloaded and printed for private study, research and teaching purposes, or for use in non-commercial products or services, provided that appropriate acknowledgement of FAO as the source and copyright holder is given and that FAO's endorsement of users' views, products or services is not implied in any way. All requests for translation and adaptation rights, and for resale and other commercial use rights should be made via or addressed to FAO information products are available on the FAO website ( ).
3 And can be purchased through This publication has been printed using selected products and processes so as to ensure minimal environmental impact and to promote sustainable forest management. Photo credits: FAO/Pius Ekpei Morguefile HIGHLIGHTS. WHEAT. food commodity markets tend to exhibit a well-balanced World wheat production in 2017. situation at the global level for nearly all the commodities is forecast to fall below last year's covered in this report, although in some cases prospects record level. However, aided by large at the country or regional level may diverge carryover stocks, global wheat markets from this positive outlook . Larger import volumes and rising should remain adequately supplied shipping costs are expected to lift the global food import bill in the 2017/18 marketing season, to over USD trillion this year, up percent from 2016. with international prices remaining subdued, especially during the first half of the season. COARSE GRAINS RICE OILCROPS.
4 With near- record production expected Global rice supplies are forecast to FAO's latest forecasts for the 2016/17. this year, supplies in 2017/18 are remain ample in 2017/18, sustained by season point towards an easing of forecast to remain ample and an expected small global production the supply and demand balance for competition among major exporters expansion. Despite generally good oilcrop products. Responding to this should again prove intense, especially output prospects, reserves held by positive outlook , international prices in view of bumper crops in the leading the major exporters could fall to a recently embarked on a downward exporters of the Southern Hemisphere. decade low, led by Thailand's efforts trend, with first indications that to liquidate public stockpiles. markets could remain well supplied in 2017/18, further weighing on prices. MEAT DAIRY FISHERIES. Growth in meat production, expected World milk production is set to Global fish production is expected to for almost all countries, will be offset increase in 2017, assisted by a grow by percent in 2017, driven by a forecast fall in China, resulting in generally favourable weather outlook by aquaculture, which continues to world output stagnating for the third and improved prices for milk in a expand at some 4 to 5 percent per consecutive year.
5 Global meat trade number of countries. Global trade in year. Supply rebounds for a number is expected to grow by percent, dairy products is projected to record a of important traded species is likely fuelled by demand from China and second year of modest growth, rising to dampen some price gains realized met by increased shipments from the by 1 percent. in 2016, while political uncertainty in United States and Brazil, in particular. multiple markets is suppressing growth in international seafood trade. OPPORTUNITIES AND EXPLORING THE ROLE OF GLOBAL. CHALLENGES IN THE BANANA MARKET LIQUIDITY IN COMMODITY PRICE. BOOMS AND SLUMPS. Banana is a leading food crop in terms of production value. With some 15 percent of global production exported, its total Periods of sharply rising and falling commodity prices are not trade value stood at some USD 8 billion in 2016, making limited to those in Agriculture . Yet, the discussion on drivers bananas the largest traded fruit crop in value terms.
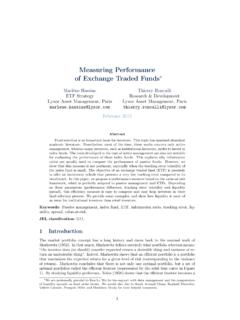
6 This of high-price episodes in food commodities generally fails note discusses a number of important issues that are shaping to adequately acknowledge regularities in the wider asset developments in global banana markets. landscape. Global liquidity emerges as a factor that might be more influential than commonly perceived. CONTENTS. 63. /Depositphotos p MARKET SUMMARIES 1-8. MARKET ASSESSMENTS 10-60. Wheat 11 OPPORTUNITIES. Coarse grains 18 AND CHALLENGES. Rice 26 IN THE BANANA. Oilcrops, oils and meals 34. Meat and meat products 42 MARKET. Milk and milk products 48. Fish and fishery products 54. /Depositphotos p 67. SPECIAL FEATURES 62-75. Opportunities and challenges in the banana market 63. Exploring the role of global liquidity EXPLORING THE ROLE. in commodity price booms and slumps 67. OF GLOBAL LIQUIDITY. IN COMMODITY PRICE. MAJOR POLICY DEVELOPMENTS 76-96 BOOMS AND SLUMPS. Grains 77. FAO food . Rice 85 COMMODITY PRICE INDICES 140. p Oilcrops 89 (May 2016 - May 2017).
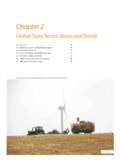
7 Meat 94. Dairy 96 2002-2004=100. 320. Sugar STATISTICAL TABLES 98-131 270. MARKET INDICATORS 132-142 220. Vegetable oils Meat Dairy Futures markets 133. Ocean freight rates 136 170. food import bills 138. Cereals The FAO price indices 140. 120. M J J A S O N D J F M A M. 2016 2017. Market summaries 4. JUNE 2017. food outlook . M. SU AR. MM KE. AR T. IES. CEREALS. Market summaries FAO's latest outlook for global cereal supply and demand in CEREAL PRODUCTION, UTILIZATION AND. 2017/18 remains favourable as demand is projected to fall STOCKS. slightly short of the anticipated production level, allowing global stocks to remain around their record-high opening Million tonnes Million tonnes 2600 800. levels. FAO currently forecasts world cereal production in 2017. at 2 594 million tonnes, 5 million tonnes lower than the 2300 600. May forecast and down million tonnes ( percent). year-on-year. The monthly decrease is mostly the result of deteriorating production prospects for coarse grains 2000 400.
8 And, to a lesser extent, for rice. Compared to 2016, much of the reduction is due to expectations of a percent contraction in global wheat output as well as lower barley 1700 200. 07/08 09/10 11/12 13/14 15/16 17/18. and sorghum production. These declines would more f'cast than offset a percent expected expansion in global Production (left axis) Utilization (left axis). maize output, driven primarily by strong rebounds in Stocks (right axis). South America and Southern Africa, and a percent increase in world rice production. World cereal utilization in 2017/18 is projected at a record level of 2 584 million tonnes, up 13 million WORLD CEREAL MARKET AT A GLANCE 1. tonnes ( percent) from 2016/17. This forecast stands 11 million tonnes below May expectations, largely reflecting 2015/16 2016/17 2017/18 Change: estim. f'cast 2017/18. downward adjustments made to historical wheat and maize over 2016/17. feed estimates, particularly for China. On an annual basis, total million tonnes %.
9 Wheat utilization is projected to decline by percent from WORLD BALANCE. 2016/17, whereas the total uses of coarse grains and rice are Production 2 2 2 expected to grow by percent and percent, respectively. Trade2 FAO's May forecast of world cereal stocks by the end Total utilization 2 2 2 of seasons in 2018 has been raised by 14 million tonnes food 1 1 1 and now stands at 703 million tonnes, up marginally Feed from the 2017 record high. Most of the month-to-month Other uses upward revision concerns wheat and maize inventories, Ending stocks3 with China accounting for much of the adjustment. Overall, SUPPLY AND DEMAND INDICATORS. the anticipated annual increase in global cereal inventories Per caput food consumption: reflects larger than earlier-expected wheat stocks, while World (kg/yr) carryovers of coarse grains could very well decline and LIFDC4 (kg/yr) those of rice would most likely remain largely steady. World stock-to-use ratio (%) World trade in cereals in 2017/18 is forecast to Major exporters stock-to- disappearance ratio (%).
10 Decline by around 5 million tonnes ( percent) to 391 million tonnes, marking the first contraction in four FAO CEREAL PRICE INDEX 2015 2016 2017 Change: (2002-2004=100) Jan-May Jan-May 2017. years. The reduction is largely the result of expectations of over Jan-May 2016. weaker import demand for wheat, maize and sorghum. %. 162 147 148 1. Rice in milled equivalent. Contact: 2. Trade refers to exports based on a July/June marketing season for wheat and coarse grains and on a January/December marketing season for rice. 3. May not equal the difference between supply (defined as production plus opening stocks) and utilization due to differences in individual country marketing years. 4. Low-Income food -Deficit countries. food outlook 1. JUNE 2017. WHEAT. Market summaries World wheat production in 2017 is forecast to fall from WHEAT PRODUCTION. UTILIZATION AND. last year's record level. However, aided by large carryover STOCKS. stocks, global wheat markets should remain adequately supplied in the 2017/18 marketing season.