Transcription of for FLUORESCENCE MICROSCOPY
1 CHROMA TECHNOLOGY CORPHANDBOOK ofOPTICAL FILTERSfor FLUORESCENCEMICROSCOPYby JAY REICHMAN 2017AN INTRODUCTION TOFLUORESCENCE MICROSCOPY 2 Excitation and emission spectraBrightness of the FLUORESCENCE signalThe FLUORESCENCE microscopeTypes of filters used in FLUORESCENCE microscopyThe evolution of the FLUORESCENCE microscopeA GENERAL DISCUSSION OF optical FILTERS 8 TerminologyAvailable products Colored filter glass Thin-film coatings Acousto- optical filters Liquid Crystal Tunable FiltersDESIGNING FILTERS FORFLUORESCENCE MICROSCOPY 14 Image Contrast FLUORESCENCE spectra Light sources Detectors BeamsplittersOptical quality optical quality parameters optical quality requirements for wide-field microscopyFILTER SETS FOR SUB-PIXEL REGISTRATION 24 FILTERS FOR CONFOCAL MICROSCOPY 25 optical quality requirements Nipkow-disk scanning Laser scanningSpectral requirements Nipkow-disk scanning Laser scanningFILTERS FOR MULTIPLE PROBE APPLICATIONS 29 REFERENCES 30 GLOSSARY 31 CHROMA TECHNOLOGY CORPHANDBOOK ofOPTICAL FILTERSfor FLUORESCENCEMICROSCOPYby JAY REICHMAN 1 FLUORESCENCE MICROSCOPY requires optical filters that have demanding spectral and physical characteristics.
2 These performance requirements can vary greatly depending on the specific type of microscope and the specific application. Although they are relatively minor components of a complete microscope system, optimally designed filters can produce quite dramatic benefits, so it is useful to have a working knowledge of the principles of optical filtering as applied to FLUORESCENCE guide is a compilation of the principles and know-how that the engineers at Chroma Technology Corp use to design filters for a variety of FLUORESCENCE microscopes and applications, including wide-field microscopes, confocal microscopes, and applications involving simultaneous detection of multiple fluorescent probes. Also included is information on the terms used to describe and specify optical filters and practical information on how filters can affect the optical alignment of a , the handbook ends with a glossary of terms that are italicized or in boldface in the more in-depth information about the physics and chemistry of FLUORESCENCE , applications for specific fluorescent probes, sample- preparation techniques, and microscope optics, please refer to the various texts devoted to these subjects.
3 One useful and readily available resource is the literature on FLUORESCENCE MICROSCOPY and microscope alignment published by the microscope CHROMA TECHNOLOGY CORPE mployee-owned Chroma Technology Corp specializes in the design and manufacture of optical filters and coatings for applications that require extreme precision in color separation, optical quality, and signal purity: low-light-level FLUORESCENCE MICROSCOPY and cytometry spectrographic imaging in optical astronomy laser-based instrumentation Raman coating lab and optics shop are integrated into a single facility operated by a staff with decades of experience in both coating design and optical fabrication. We are dedicated to providing the optimum cost-effective solution to your filtering requirements. In most cases our staff will offer, at no extra charge, expert technical assistance in the design of your optical system and selection of suitable filtering components.
4 2000-2010 Chroma Technology Corp An Employee-Owned Company 10 Imtec Lane, Bellows Falls, Vermont 05101-3119 USAT elephone: 800-8-CHROMA or 802-428-2500 Fax: 802-428-2525 E-mail: Website: is a molecular phenomenon in which a substance absorbs light of some color and almost instantaneously1 radiates light of another color, one of lower energy and thus longer wavelength. This process is known as excitation and emission. Many substances, both organic and non-organic, exhibit some FLUORESCENCE . In the early days of FLUORESCENCE MICROSCOPY (at the turn of the century) microscopists looked at this primary FLUORESCENCE , or auto FLUORESCENCE , but now many dyes have been developed that have very bright FLUORESCENCE and are used to selectively stain parts of a specimen. This method is called secondary or indirect FLUORESCENCE .
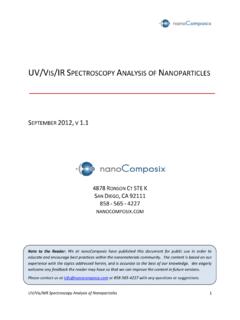
5 These dyes are called fluorochromes, and when conjugated to other organically active substances, such as antibodies and nucleic acids, they are called fluorescent probes or fluorophores. (These various terms are often used interchangeably.) There are now fluorochromes that have characteristic peak emissions in the near-infrared as well as the blue, green, orange, and red colors of the spectrum. When indirect FLUORESCENCE via fluorochromes is used, the autofluorescence of a sample is generally considered undesirable: it is often the major source of unwanted light in a microscope AND EMISSION SPECTRAF igure 1 shows a typical spectrum of the excitation and emission of a fluorochrome. These spectra are generated by an instrument called a spectrofluorimeter, which is comprised of two spectrometers: an illuminating spectrometer and an analyzing spectrometer.
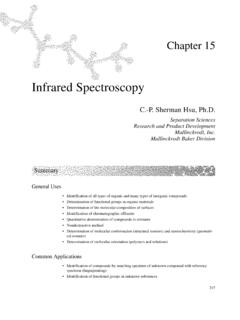
6 First the dye sample is strongly illuminated by a color of light that is found to cause some FLUORESCENCE . A spectrum of the fluorescent emission is obtained by scanning with the analyzing spectrometer using this fixed illumination color. The analyzer is then fixed at the brightest emission color, and a spectrum of the excitation is obtained by scanning with the illuminating spectrometer and measuring the variation in emission intensity at this fixed wavelength. For the purpose of designing filters, these spectra are normalized to a scale of relative color spectra are described quantitatively by wavelength of light. The most common wavelength unit for describing FLUORESCENCE spectra is the nanometer (nm). The colors of the visible spectrum can be broken up into the approximate wavelength values (Figure 2): violet and indigo 400 to 450 nm blue and aqua 450 to 500 nm green 500 to 570 nm yellow and orange 570 to 610 nm red 610 to approximately 750 nm1 The time it takes for a molecule to fluoresce is on the order of nanoseconds (10 -9 seconds).
7 Phosphorescence is another photoluminescence phenomenon, with a lifetime on the order of milliseconds to 1 Generic excitation and emission spectra for a fluorescent UnitsExcitation SpectraEmission SpectraAN INTRODUCTION TO FLUORESCENCE MICROSCOPY3On the short-wavelength end of the visible spectrum is the near-ultraviolet (near-UV) band from 320 to 400 nm, and on the long-wavelength end is the near-infrared (near-IR) band from 750 to approximately 2500 nm. The broad band of light from 320 to 2500 nm marks the limits of transparency of crown glass and window glass, and this is the band most often used in FLUORESCENCE MICROSCOPY . Some applications, especially in organic chemistry, utilize excitation light in the mid-ultraviolet band (190 to 320 nm), but special UV-transparent illumination optics must be are several general characteristics of FLUORESCENCE spectra that pertain to FLUORESCENCE MICROSCOPY and filter design.
8 First, although some substances have very broad spectra of excitation and emission, most fluorochromes have well-defined bands of excitation and emission. The spectra of Figure 1 are a typical example. The difference in wavelength between the peaks of these bands is referred to as the Stokes shift. Second, although the overall intensity of emission varies with excitation wavelength, the spectral distribution of emitted light is largely independent of the excitation Third, the excitation and emission of a fluorochrome can shift with changes in cellular environment such as pH level, dye concentration, and conjugation to other substances. Several dyes (FURA-2 and Indo-1, for example) are useful expressly because they have large shifts in their excitation or emission spectra with changes in concentration of ions such as H + (pH level), Ca 2+, and Na +.
9 Lastly, there are photochemical reactions that cause the FLUORESCENCE efficiency of a dye to decrease with time, an effect called photobleaching or OF THE FLUORESCENCE SIGNALS everal factors influence the amount of FLUORESCENCE emitted by a stained specimen with a given amount of excitation intensity. These include 1) the dye concentration within stained sections of the specimen, and the thickness of the specimen; 2) the extinction coefficient of the dye; 3) the quantum efficiency of the dye; and, of course, 4) the amount of stained material actually present within the field of view of the microscope. The extinction coefficient tells us how much of the incident light will be absorbed by a given dye concentration and specimen thickness, and reflects the wavelength-dependent absorption characteristics indicated by the excitation spectrum of the fluorochrome.
10 Although many of the fluorochromes have high extinction coefficients at peak excitation wavelengths, practical sample preparation techniques often limit the maximum concentration allowed in the sample, thus reducing the overall amount of light actually absorbed by the stained 2 Color regions of the The emission spectrum might change shape to some extent, but this is an insignificant effect for most applications. See Lakowicz (1983) for an in-depth description of the mechanism of quantum efficiency, which is the ratio of light energy absorbed to FLUORESCENCE emitted, determines how much of this absorbed light energy will be converted to FLUORESCENCE . The most efficient common fluorochromes have a quantum efficiency of approximately , but the actual value can be reduced by processes known as quenching, one of which is photobleaching.