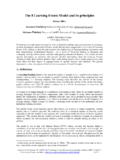
Transcription of Four of the top seven U.S. shale gas plays have peaked
1 A REALITY CHECK ON GOVERNMENT FORECASTS FOR A LASTING TIGHT OIL & shale GAS BOOM Four of the top seven shale gas plays have peaked The top seven shale gas plays account for 88% of current production and 88% of the EIA s forecast of cumulative production through 2040. But four of these plays are already in decline. Of these plays only the Marcellus, Bakken and the Eagle Ford can be expected to grow significantly. play Year of Peak Production Change in Production Since Peak (as of June 2014) Barnett 2011 -18% Haynesville 2012 -46% Fayetteville 2012 Woodford 2013 -4% Marcellus No Peak Yet Production Increasing Eagle Ford* No Peak Yet Production Increasing Bakken* No Peak Yet Production Increasing *Gas associated with oil production.
2 Well productivity in the top shale gas plays has largely stalled One of the keys to the so-called shale revolution is supposed to be technological innovation, making plays ever-more productive in the face of the steep well decline rates and the move from sweet spots to lower quality parts of plays . But despite years of concerted efforts, average well productivity has gone flat in all the major shale gas plays except the Marcellus. Average Production Over First Twelve Months of shale Gas play Wells A REALITY CHECK ON GOVERNMENT FORECASTS FOR A LASTING TIGHT OIL & shale GAS BOOM Drilling rates in the top shale gas plays can t maintain production Because productivity of shale wells declines rapidly, many new wells must be drilled just to maintain existing production levels.
3 But of the seven major shale gas plays analyzed, four are not seeing enough drilling to maintain let alone grow production. play Current Drilling Rate (wells per year) Drilling Rate Needed to Maintain Current Rate of Production (wells per year) Barnett 384 1,161 Haynesville 215 400 Fayetteville 500 600 Woodford <300 405 Marcellus 1,320 1,000 Eagle Ford* 3,550 2,672 Bakken* 2,000 1,468 *Gas associated with oil production. If the EIA expects higher gas prices to turn around drilling rates, it s not reflected in its forecast, which expects only modest increases in prices: below $5 per MMBtu through 2024 and no more than $6 per MMBtu through 2029 (2012 dollars). shale gas wells are short-lived Conventional gas wells can produce for over 30 or more years, according to the industry.
4 shale gas wells, in contrast, have very high initial production decline rates, suggesting that claims these wells will be significantly productive for many decades are unwarranted. play Percentage of Horizontal Wells Shut Down Mean Lifetime of Shut Wells Mean Lifespan for All Wells (To Date) Average Three-Year Production Decline Rate Barnett 14% 37 months 58 months 75% Haynesville 5% 21 months 38 months 88% Fayetteville 8% 31 months 44 months 79% Woodford 10% 32 months 42 months 74% Marcellus N/A N/A N/A 74% to 82% Eagle Ford* N/A N/A N/A 80% Bakken* N/A N/A N/A 81% *Gas associated with oil production. A REALITY CHECK ON GOVERNMENT FORECASTS FOR A LASTING TIGHT OIL & shale GAS BOOM EIA s forecast shale gas recovery by 2040 is not supported by the data The EIA forecasts steadily growing shale gas production through 2040 ( growth per year on average).
5 But actual production data point to a steady decline of production after 2016. What is the EIA basing its rosy forecast on? Most Likely shale Gas Production vs. EIA Forecasts, to 2040 Here s one answer: unproved resources. shale gas producers and the EIA report proved reserves, a definition with legal weight describing hydrocarbon deposits recoverable with current technology under current economic conditions. The EIA also estimates unproved technically recoverable resources which have loose geological constraints and no implied price required for extraction, and hence are uncertain. A closer look at the EIA's forecasts reveals that it assumes recovery of the vast majority of (and in some cases even more than) the major shale gas plays proved reserves and unproved resources by 2040 a highly optimistic assumption.
6 play EIA Forecast Recovery of shale Gas Proved Reserves and Unproved Resources Barnett Haynesville Fayetteville Woodford Marcellus Eagle Ford* Bakken* *Gas associated with oil production. A REALITY CHECK ON GOVERNMENT FORECASTS FOR A LASTING TIGHT OIL & shale GAS BOOM Watch what they do, not what they say, in Bakken and Eagle Ford It s clear by looking at drilling locations that oil producers have concentrated on the most productive and profitable areas in both the Bakken and Eagle Ford in so-called "sweet spots." If the entire area designated by the EIA for these plays were productive and profitable, the dispersion of wells would be much greater.
7 In fact, given actual drilling results, the prospective play areas are considerably smaller than estimated by the EIA. Even within the prospective area there is a large variation in well quality as indicated by the maps below (colored by initial well productivity). If the total play area designated by the EIA were actually productive, there would certainly be wells drilled there. A reduced play area limits the number of locations available to be drilled and hence the ultimately recoverable resource. Bakken Tight Oil play Eagle Ford Tight Oil play A REALITY CHECK ON GOVERNMENT FORECASTS FOR A LASTING TIGHT OIL & shale GAS BOOM Can they all climb the hill and stay on top?
8 The EIA expects four plays that have produced oil for several decades to make up more than a quarter of American tight oil production in just a few years, and to remain highly productive all the way to 2040, based on the application of new technology. But doing so would mean delivering four to five times the amount of oil than these plays produced from conventional reservoirs over their entire history. Production in shale plays can certainly grow very rapidly; but drillers experience so far shows that maintaining very high rates of production for years let alone decades is no sure thing. Actual production to 2013 (transparent grey) compared to EIA s Annual Energy Outlook 2014 forecast to 2040 (red) Spraberry Tight Oil play Austin Chalk Tight Oil play Wolfcamp Tight Oil play Niobrara-Codell Tight Oil play