Transcription of FREIGHT RATES AND MARITIME TRANSPORT COSTS
1 FREIGHT RATES . AND MARITIME . 3. TRANSPORT . COSTS . Developing countries, especially in Africa and Oceania, pay 40 to 70 per cent more on average for the international TRANSPORT of their imports than developed countries. The main reasons for this situation are to be found in these regions' trade imbalances, pending port and trade facilitation reforms, as well as lower trade volumes and shipping connectivity. There is potential for policymakers to partly remedy the situation through investments and reforms, especially in the regions' seaports, transit systems and customs administrations. Container FREIGHT RATES remained volatile throughout 2014 although with different trends on individual trade lanes. Market fundamentals have not changed significantly despite the expansion in global demand for container shipping. This was mainly due to pressure from the constant supply of vessels that the market RATES continued to face, with the introduction of very large units on mainlane trades and the cascading effect on non-mainlanes trades.
2 The tanker market, which encompasses the transportation of crude oil, refined petroleum products and chemicals, witnessed an equally volatile FREIGHT rate environment in 2014 and early 2015. The dry bulk market FREIGHT RATES faced another challenging year influenced by the surplus capacity that still exists and the uncertainties in demand projections. Bulk carrier earnings fell 5 per cent from 2013 to reach an average of $9,881 per day in 2014. The low level of earnings exerted financial pressure on owners and led to several companies filing for bankruptcy. 48 REVIEW OF MARITIME TRANSPORT 2015. A. DETERMINANTS OF MARITIME these groups and discuss the options for policymakers to help reduce international MARITIME TRANSPORT COSTS . TRANSPORT COSTS . In recent years, policymakers and industry players Policymakers and shippers have an interest in have increasingly mainstreamed environmental understanding the determinants of international sustainability criteria into their planning processes, MARITIME TRANSPORT COSTS .
3 MARITIME TRANSPORT handles policies and structures, not only to respond to global over 80 per cent of the volume of global trade (and challenges for reducing emissions and improving about 90 per cent of developing countries' volume the environmental footprint but also as a means of international trade is seaborne) and knowing the to improve energy savings and to achieve a more reasons for differences in what a trader pays for the efficient allocation of available resources. Specific international TRANSPORT of merchandise goods can help actions may involve developing fuel-efficient vessels, identify possible areas for intervention by policymakers. improving energy efficiency, reshaping TRANSPORT Extensive recent research has helped identify the main architecture and networks, adapting and developing determinants of FREIGHT COSTS (see Cullinane et al., appropriate infrastructure, rethinking and optimizing 2012; ECLAC, 2002; Sourdin and Pomfret, 2012; and operating procedures of FREIGHT logistics, harnessing Wilmsmeier, 2014; and the literature reviewed therein).
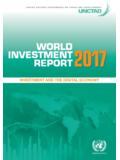
4 New technologies, and supporting information and Figure summarizes seven groups of determinants. communications technology and intelligent TRANSPORT The remainder of this section will introduce each one of systems. Figure Determinants of MARITIME TRANSPORT COSTS Ports Infra- and supertructure Port productivity Port operator model Port tariffs Shipped product Trade flows Volume of Trade imbalances shipment Volumes of trade Value Complementarity Type of produce of trade Determinants of international MARITIME TRANSPORT COSTS Structure of the Facilitation MARITIME industry Trade facilitation Competition TRANSPORT Liner services faciliation supply Regulation Position within the Ship operating COSTS global shipping network Crewing B. unker Connectivity R egistration Centrality Distance Source: UNCTAD secretariat, based on Wilmsmeier, 2014. CHAPTER 3: FREIGHT RATES AND MARITIME TRANSPORT COSTS 49. 1. Trade and TRANSPORT facilitation as measures included in article 10 of the WTO TFA) have a particularly high statistical correlation with a country's Reducing waiting times in seaports for ships and ranking in international logistics benchmarks, such as the their cargo has a direct bearing on trade COSTS .
5 First, World Bank Logistics Performance Index (figure ). from the shippers' perspective, it implies lower COSTS associated with the holding of inventory en route to 2. Ship operating COSTS the final destination. It has been estimated that each additional day cargo spends in transit is equivalent to Technological advances have led to a continuous an ad valorem tariff of to per cent (Hummels and reduction in vessel operating COSTS over the decades. Schaur, 2013). Second, waiting times also imply COSTS Improved fuel efficiency, economies of scale, and to the carrier, which will ultimately have to be passed on automation in port operations all help to reduce to the client through higher FREIGHT charges. Wilmsmeier environmental and financial COSTS (see chapter 2). et al. (2006) estimated that a 10 per cent reduction of However, the drive to invest in lower operating COSTS may the time it takes to clear customs implies a reduction of have some negative repercussion on FREIGHT RATES .
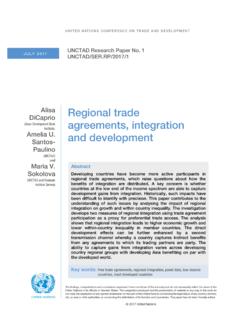
6 For the MARITIME FREIGHT of about per cent. example, as carriers invest in larger and more energy- Different trade facilitation measures can be implemented efficient vessels in the current market situation to to reduce waiting times and improve the logistics achieve economies of scale or to improve fuel efficiency . performance of countries in other ways. It has been they inadvertently also contribute to a further oversupply suggested by UNCTAD (2015) that the transparent of capacity. While the individual carrier may benefit from publication of trade-related information (such as measures cost savings from deploying bigger vessels, all carriers included in article 1 of the WTO TFA) as well as the bear the burden of the resulting oversupply and lower simplification and reduction of customs formalities (such FREIGHT levels to the benefit of importers and exporters. Figure Statistical correlation between articles of the WTO TFA and indicators for trade efficiency Source: UNCTAD secretariat, based on data from the World Bank (Logistics Performance Index and Doing Business Index) and WTO (number of category A notifications).)
7 Note: The axis in the chart represents the partial correlation coefficient between the notification of trade facilitation measures under the 12 TFA articles and the value in the Logistics Performance and the Doing Business indices. 50 REVIEW OF MARITIME TRANSPORT 2015. Oversupply of shipping capacity combined with a FREIGHT COSTS will have to cover at least the operating weak global economy has been a main factor affecting COSTS of the carrier; put differently, if the price of a FREIGHT RATES in recent years. In an effort to deal with TRANSPORT service does not cover at least the fuel, low FREIGHT rate levels and to leverage some earnings, communications and crewing COSTS , the carrier will carriers have looked at measures to improve efficiency anchor the ship and not offer the TRANSPORT service. In and optimize operations in order to reduce unit the long term, however, the FREIGHT charges will have operating COSTS .
8 Some of these measures involved to cover the total average COSTS , including the fixed operational consolidation, slow steaming, idling, and COSTS . As operating (variable) COSTS are lower today replacing smaller and older vessels with newer and than in previous decades, this means that FREIGHT RATES more fuel efficient ones. may also reach lower levels than in the past. Lower Although operating COSTS in shipping have been unit operating COSTS in bigger vessels, however, can decreasing, the total COSTS of the TRANSPORT system only be reached if utilization RATES are sufficient; if they have declined less. First, total COSTS for the carrier are not, the carrier might be affected by diseconomies have to take into account the COSTS of investing in of scale. The risk of the latter also increases with ship new assets. Second, larger ships and the increasing size, particularly if demand and supply do not develop use of hub ports also require ports and port cities to in line with each other.
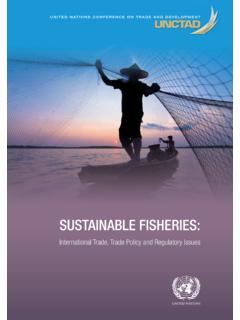
9 Effectively, FREIGHT RATES appear invest in additional capacities for storage, handling to fluctuate more today than in earlier decades, and and intermodal connections. These additional COSTS the changing structure of operating versus fixed COSTS including external social and environmental COSTS is probably one of the reasons for this trend. are not born by the carrier, but by the ports and local communities. 3. Distance and a country's position Lower operating COSTS as compared to higher fixed within shipping networks COSTS (that is, the capital COSTS associated with larger and more fuel-efficient ships) will likely also lead Shipping goods over a longer distance requires more to more volatile FREIGHT RATES . In the short term, the time (capital COSTS ) and fuel (operating COSTS ). Thus, Figure The no-relationship between distance and MARITIME TRANSPORT COSTS 12. 10. TRANSPORT cost per ton (ln). 8. 6. R = 4. 2.
10 0. 0 2000 4000 6000 8000 10000 12000 14000. Nautival miles Source: ECLAC and UNCTAD secretariat, based on data from the International TRANSPORT Database ECLAC, 2013. Note: Based on 12,595 observations of MARITIME TRANSPORT COSTS in international trade for the year 2013 at the Standard International Trade Classification two-digit level. CHAPTER 3: FREIGHT RATES AND MARITIME TRANSPORT COSTS 51. trading partners that are further away from main Research on liner shipping connectivity frequently markets might expect to be also confronted with concludes that the position within a network has a higher bilateral FREIGHT COSTS . As regards the impact of more significant impact than the notion of geographical distance, the traditional gravity model would suggest distance (Kumar and Hoffmann, 2002; M rquez-Ramos that countries that are further away from each other et al., 2005; Wilmsmeier et al., 2006; Wilmsmeier, 2014.)