Transcription of FTIR Spectroscopy: Attenuated Total Reflectance (ATR)
1 IntroductionMid-Infrared (IR) spectroscopy is an extremely reliable and well recognized fingerprintingmethod. Many substances can be characterized, identified andalso of the strengths of IR spec - troscopy is its ability as an ana-lytical technique to obtain spectrafrom a very wide range of solids,liquids and gases. However, inmany cases some form of samplepreparation is required in order to obtain a good quality IR spectrometershave been used to analyze solids,liquids and gases by means oftransmitting the infrared radia-tion directly through the the sample is in a liquid or solid form the intensity of thespectral features is determined bythe thickness of the sample andtypically this sample thicknessFT-IR SpectroscopyAttenuated Total Reflectance (ATR)TECHNICAL NOTEF aster samplingImproving sample-to-samplereproducibilityMinimizin g user-to-user spectralvariationHigher quality spectral databases for more precise material verificationand identificationKey FeaturesTECHNICAL NOTEFT-IR in contactwith evanescent waveTo DetectorAT RCrystalInfraredBeamcannot be more than a few tens ofmicrons.
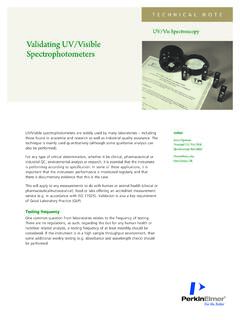
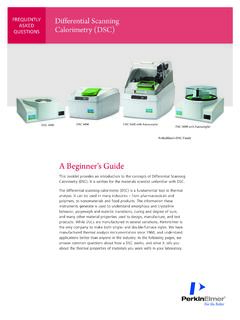
2 Figure 1 displays a typicalIR transmission technique of Attenuated TotalReflectance (ATR) has in recentyears revolutionized solid andliquid sample analyses because it combats the most challengingaspects of infrared analyses, namely sample preparation andspectral surrounding traditional transmissionsample preparationThe two most common forms ofsample preparation for solids bothinvolve grinding the material to afine powder and dispersing it in amatrix. The ground material can bedispersed in a liquid to form a most commonly used liquid ismineral oil (nujol). Typically nomore than 20 mg of solid is groundand then one or two drops of nujolare used to create a paste which isthen spread between two Mid-Infra-redtransparent windows NaCl,KBr, CaF2. The sample is now readyto be placed in the spectrometer foranalysis by bromide (KBr) is prob-ably the most widely used matrixmaterial. Between 1 and 3 mg ofground material needs to be mixedthoroughly with about 350 mg ofground KBr.
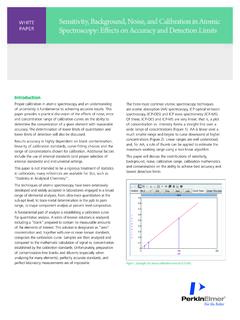
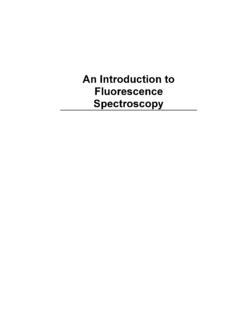
3 The mixture is nowtransferred to a die that has a barreldiameter of 13 mm (Figure 2). This isthen placed in a suitable press andpressed (evacuation is optional) ataround 12,000 psi for one to twominutes. Re-crystallization of theKBr results in a clear glassy diskabout 1 mm thick. This disk is nowready to be analyzed by are traditionally analyzed as thin films in cells (Figure 3), a cellconsists of two IR transparent win-dows. A Teflon spacer is generallyused to produce a film of the desiredthickness or pathlength. A constantpathlength is highly desirable whenperforming quantitative , sample preparation is easierfor liquid transmission studieswhen compared to solid transmis-sion sampling but both suffer frominevitable reproducibility issuesgiven the complexity of the samplepreparation methods. In addition,preparation can be very messy andtime consuming and is further com-plicated by difficulties in gettingsample to matrix ratios correct andhomogenous throughout the materials involved are fragile andhydroscopic and the quality of meas-urements can be adversely affected ifhandled or stored incorrectly.
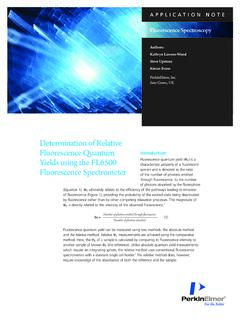
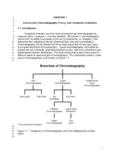
4 Thetechnique of Attenuated TotalReflectance addresses these of ATRAn Attenuated Total reflectionaccessory operates by measuring the changes that occur in a totallyinternally reflected infrared beamwhen the beam comes into contactwith a sample (indicated in Figure 4).An infrared beam is directed ontoan optically dense crystal with ahigh refractive index at a certainangle. This internal reflectancecreates an evanescent wave thatextends beyond the surface of thecrystal into the sample held in con-tact with the crystal. It can be easierto think of this evanescent wave asa bubble of infrared that sits on thesurface of the crystal. This evanes-cent wave protrudes only a few mic-rons ( - 5 ) beyond the crystalsurface and into the sample. Conse-quently, there must be good contactbetween the sample and the crystalsurface. In regions of the infraredspectrum where the sample absorbsenergy, the evanescent wave will beattenuated or altered. The attenuatedenergy from each evanescent wave 2 Figure Mid-Infrared spectrum of bromide 13 mm (l) and demountable (r)liquid KBr DieGermanium has a much better work-ing pH range and can be used toanalyze weak acids and has by far the highestrefractive index of all the ATRmaterials available which meansthat the effective depth of pene-tration is approximately 1 most samples this will result in a weak spectrum being produced,however, this is an advantage whenanalyzing highly absorbing materi-als; carbon black filled rubbers aretypically analyzed using GermaniumATR accessories.
5 Diamond is by far the best ATR crys-tal material because of its robustnessand durability. The original purchasecost is obviously higher than that ofother crystal materials available, butover the instrument s lifetime re-placement costs should be same cannot be said of ZincSelenide or Germanium, both ofwhich can scratch and break withimproper use. As with all FT-IR measurements, aninfrared background is collected, inthis case, from the clean ATR crystals are usually cleaned by using a solvent soaked piece oftissue. Typically water, methanol orisopropanol are used to clean ATRcrystals. The ATR crystal must bechecked for contamination and carryover before sample presentation,this is true for all liquids and materials, and also withfine powders but many solids givevery weak spectra because the con-tact is confined to small areas. Theeffects of poor contact are greatest at shorter wavelengths where thedepth of penetration is issue of solid sample/crystalcontact has been overcome to a greatextent by the introduction of ATRaccessories with very small crystals,typically about 2 mm across.
6 Themost frequently used small crystalATR material is diamond because ithas the best durability and chemicalinertness. These small area ATR crys-tal top-plates generally provide only asingle reflection but this is sufficient,given the very low noise levels ofPerkinElmer s modern FT-IR spec -trometers. Much higher pressure withlimited force can now be generatedonto these small areas. A muchsmaller area of contact is now re-quired in comparison to the HATR units. As a result, spectra can beobtained from a wide variety ofsolid materials including minerals. Crystal materials and cleaningThere are a number of crystal mate-rials available for ATR. Zinc Selenide(ZnSe) and Germanium are by far the most common used for HATR sampling. Zinc Selenide is a rela-tively low cost ATR crystal materialand is ideal for analyzing liquidsand non-abrasive pastesand gels but it is notparticularly robust with a working pH range of 5-9. ZnSe scratches quiteeasily and so care mustbe taken when cleaningthe crystal.
7 It is recom-mended that lint freetissue is passed back to the IR beam, whichthen exits the opposite end of thecrystal and is passed to the detectorin the IR spectrometer. The systemthen generates an infrared the technique to be successful,the following two requirements mustbe met: The sample must be in directcontact with the ATR crystal,because the evanescent wave orbubble only extends beyond thecrystal - 5 . The refractive index of the crys-tal must be significantly greaterthan that of the sample or elseinternal Reflectance will not oc-cur the light will be transmittedrather than internally reflected inthe crystal. Typically, ATR crystalshave refractive index values be-tween and at 2000 cm-1. It is safe to assume that the majorityof solids and liquids have muchlower refractive accessoriesThe traditional ATR design in whicha thin sample was clamped againstthe vertical face of the crystal hasbeen now been replaced by a hori-zontal design.
8 In horizontal ATR(HATR) units, the crystal is a paral-lel-sided plate, typically about 5 cmby 1 cm, with the upper surface ex-posed (Figure 4). The number ofreflections at each surface of thecrystal is usually between five andten, depending on the length andthickness of the crystal and the angleof incidence. When measuring solids by ATR, it is essential to ensure good opticalcontact between the sample and thecrystal. The accessories have devicesthat clamp the sample to the crystalsurface and apply pressure. Thisworks well with elastomers and multiple reflection ATR in contactwith evanescent waveTo DetectorAT RCrystalInfraredBeam4 Analyzing liquidsAfter the crystal has been cleanedand an infrared background has been collected, the liquid is simplypoured onto the crystal (Figure 5).The whole crystal must be covered ifperforming a quantitative or qualita-tive analysis. The crystal is recessedinto the metal plate to retain thesample. Pastes and other semi-solidsamples are readily measured byspreading them on the crystal.
9 Hori-zontal ATR units are often used forquantitative work in preference totransmission cells because they areeasier to clean and the crystal area has beencleaned and the background col-lected, the solid material is placedonto the small crystal area (Figure 6).Experience has shown that idealresults from powder samples havebeen achieved by placing justenough sample to cover the crystalarea. The sample height should notbe more than a few millimeters. Once the solid has been placed on thecrystal area, the pressure arm shouldbe positioned over the crystal/samplearea. When using the Spectrum 100 Series Universal ATR accessory, the pressure arm locks into a preciseposition above the diamond crystal(Figure 7). Force is applied to thesample, pushing it onto the dia-mond strongest bands here extendbeyond 20% T with relativelylittleforce applied; the force gauge isregistering 80 N. A lot more pres-sure would need to be applied whenanalyzing high density polymers andcoatings on metal surfaces.
10 Once theuser is satisfied with the spectrumshown in this Preview Mode , thedata is then collected in the normalmanner. The force should not beadjusted when co-adding the finalspectrum. Unlike transmissionmeasurements, ATR sampling doesnot produce totally absorbingspectral bands because the effectivepath-length is controlled by thecrystal properties thereby minimiz-ing sample re-preparation time. After the spectrum has been col-lected, which should typically takeno more than 32 seconds, the usermust return to the Preview Mode .This mode is now used to checkthat the crystal area is clean beforeplacing the next sample on the cry-stal. A 100% T line with no spectralfeatures (Figure 9) should be seen ifthe crystal is clean, if spectral fea-tures are seen, the crystal shouldbe cleaned again using a solventsoaked tissue. The next sample canbe placed on the crystal area oncethe 100% T line has been displayedand the sampling steps are is an IR sampling technique thatprovides excellent quality data inconjunction with the best possiblereproducibility of any IR samplingtechnique.