Transcription of FTSE 350 Executive and Board remuneration report …
1 Into focusFTSE 350 Executive and Board remuneration reportJanuary 2016 IntroductionWelcome and introductionWelcome to our Into focus report which looks at recently published Directors remuneration Reports (DRRs) for the FTSE 350 and considers the implications of the trends emerging for 2016 and beyond. This report analyses Executive remuneration and Board fee quantum and policy information for companies in the FTSE 350 as at 28 August 2015. The analysis is based on information disclosed in the 2014/15 annual reports and accounts of these this report is not intended to constitute a benchmarking tool, we have presented our data in four market capitalisation comparator groups to allow reflection on the most appropriate remuneration environmentIn 2015 Executive remuneration has remained on the Board agenda with the ongoing quest to demonstrate a clear link between pay achieved and performance delivered, not least to satisfy the scrutiny of various stakeholder groups and the media.
2 Our research into annual reporting, published in September 2015, found that companies continue to struggle to make linkages throughout the various aspects of annual reports. Only 9% of annual report and accounts had a clear link all the way from strategy, to key performance indicators, to principal risks and through to the changes to the reporting regulations, which resulted in the introduction of the mandatory vote on policy, have now largely bedded down, the freedom of companies to act on their Executive remuneration is facing further constraints. In its research paper published in March 2015, the Department for Business, Innovation and Skills (BIS) considered how companies have responded to the new reporting requirements. While compliance with the regulations was generally high, two particular findings were highlighted:1. Many companies did not state a maximum opportunity for Executive salaries. The BIS report suggests compliance can be achieved either by setting a level above which salary will not increase for the policy period, specifying salaries for the three years or setting one salary for the period.
3 2. When a particular disclosure was not applicable, many companies opted to omit the disclosure entirely whereas provision of a statement to the effect that it did not apply would be more helpful to , the latest version of the UK Corporate Governance Code contains a toughened requirement for all long and short term incentive plans to provide for withholding (malus) and recovery (clawback) and to specify when they will be applied (for accounting periods beginning on or after 1 October 2014 and applying to all companies with a premium listing of equity shares). Companies that do not have these provisions in place must justify the reasoning to their a number of early adopters have already introduced such provisions, some practicalities surrounding their implementation remain yet to be resolved. One such issue, the taxation of clawback on share schemes, will become clearer in 2016 following the expected publication of guidance from HMRC.
4 As companies begin to review policies in advance of their second vote by shareholders, clarity on matters such as this will further expedite the inclusion of clawback and malus salaries continue to increase and the median of 2015/16 proposed salary increases is 1 | IntroductionIn its letter accompanying the publication of its 2015 principles of remuneration , the Investment Association (IA) stated that executives should not expect regular salary increases but, where given, they should be limited to inflation or that of the general workforce. The IA has also created a new body, the Executive remuneration Working Group, bringing together senior representatives from the investment community and the corporate world to bring forward proposals for a radical simplification of Executive pay . The group will publish initial results in spring focus for Executive remunerationThis report shows a fall in the FTSE 100 Chief Executive Officers (CEOs) median salary for a second year, providing evidence of restraint in pay increases.
5 However, Executive salaries continue to increase and the median of 2015/16 proposed salary increases is In light of the above, we expect both further restraint in, and further scrutiny of, Executive salaries to continue. Although analysis shows that pensions and other benefits have not been a focus in the past year, employers will soon need to consider the wider impact that the reduction in annual allowance for registered pension schemes, beginning in the 2016/17 tax year, will have on employee reward. This includes potential revisions to both the pension policy and wider remuneration framework to ensure efficient reward report also shows that although median bonus opportunity across the FTSE 350 remains unchanged, the median of increases in bonus earned among FTSE 350 CEOs was As economic conditions and business performance improve moving further into 2016, remuneration Committees will be under greater pressure to set performance metrics and targets which investors perceive to be sufficiently stretching, executives perceive to be fair and which continue to enhance financial and non-financial drivers of business executives must wait longer for their remuneration .
6 Sixty eight percent of FTSE 350 companies now include deferral in their annual bonus plans, eighty percent of which require some bonus to be deferred for three or more years. We expect this number to increase in 2016 as more companies look to align their remuneration arrangements with good practice elsewhere and introduce malus and clawback in response to the UK Corporate Governance Code s requirements. The findings also show an increased prevalence, across all FTSE segments, of companies requiring executives to hold vested long-term incentive awards for an additional period. While this has not yet affected the median combined performance and holding period, for over 25% of companies the combined period is now five or more years. Over time we expect the market norm to move towards a five year , we expect that the Executive remuneration environment will be as interesting and challenging as ever in 2016. remuneration Committees and Reward Directors will continue to face the perennial challenge of attracting, retaining and motivating the calibre of talent required to deliver their performance goals without over-paying or over-complicating their reward framework, in a world where the scope for creativity feels increasingly report contains analyses of Executive remuneration quantum and policy information disclosed in the most recent annual reports with year ends in the twelve months to 31 May 2015.
7 The data has been analysed by four FTSE 350 segments, based on FTSE index and ranking as at 28 August 2015. The four segments are: FTSE 100, FTSE 250, FTSE 250 Top ( , companies in positions 101 to 225) and FTSE 250 Bottom (companies in positions 226 to 350). Data is drawn from the Meis Executive remuneration Database, a source of disclosed remuneration data. The report also provides commentary on the trends in Executive remuneration and highlights year-on-year changes in practice and policy. Commentary and analyses have been undertaken for full year incumbents in three Executive roles: CEO, Chief Finance Officer (CFO) and Other Directors. Other Directors includes all other Executive roles on the Main Board for which data has been disclosed in the annual reports and accounts. Assessments include a range of statistical analyses of the underlying market data for the individual elements of compensation, including the lower quartile (25th percentile), median (50th percentile), upper quartile (75th percentile) and average (mean).
8 Please note that the data analysis for each individual compensation element is independently arrayed and thus the median values of individual analyses may not sum to the median of combined elements ( , total remuneration ).Definition of statistical measuresLower quartile (25th percentile): the data point at which 25% of the data is below and 75% is above that reported levelMedian (50th percentile): the data point at which 50% of the data is below and 50% is above that reported levelUpper quartile (75th percentile): the data point at which 75% of the data is below and 25% is above that reported levelAverage (arithmetic mean): the value obtained by dividing the sum of a set of quantities by the number of quantities in the focus | FTSE 350 Executive and Board remuneration report2 Section 2 remuneration tables remuneration tablesFTSE 100 (000s)MedianSalaryBenefitsPensionTotal bonusLTIT otal remunerationCEO 837 40 250 1,115 2,089 4,064 CFO 510 23 131 600 1,173 2,203 Other Directors 441 27 112 555 1,041 1,923 FTSE 250 (000s)MedianSalaryBenefitsPensionTotal bonusLTIT otal remunerationCEO 506 22 93 481 848 1,504 CFO 330 17 60 276 481 926 Other Directors 325 18 53 297 531 982 FTSE 250 Bottom (000s)MedianSalaryBenefitsPensionTotal bonusLTIT otal remunerationCEO 476 19 76 419 656 1,165 CFO 313 16 50 220 426 723 Other Directors 289 18 46 229 454 814 FTSE 250 Top (000s)
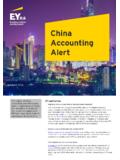
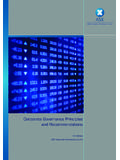
9 MedianSalaryBenefitsPensionTotal bonusLTIT otal remunerationCEO 539 22 109 591 1,053 1,897 CFO 359 18 70 321 683 1,139 Other Directors 337 18 59 312 671 1,215 Market remunerationMedian total remuneration of CEOs and CFOs of FTSE 100 companies was more than double that of FTSE 250 companies. This differential between FTSE 100 and FTSE 250 has become more pronounced for CEOs with total remuneration moving from double in 2014 to over times that of FTSE 250 1: Total remuneration of FTSE 350 directors, by FTSE segment (median)Data sourced from Single Total Figure of remuneration tables published in company annual report and accounts. As such total bonus figures reflect actual bonus awarded (including deferred components not subject to further performance testing) and LTI figures reflect amount realised in year (or appropriate estimation).Note: Market data percentiles and averages are independently arrayed, therefore, they should not be expected to sum to the market data percentiles and averages for total focus | FTSE 350 Executive and Board remuneration report4 Section 2 | remuneration tablesSection 3 Fixed pay Section 3 | Fixed payBase salaryGenerally, Executive base salaries continue to be correlated with company market capitalisation, although care should be taken when benchmarking against market capitalisation alone, due to its 2: Median base salary of FTSE 350 directors (by FTSE segment)The 2014/15 reported median FTSE 100 CEO base salary fell for a second year whereas the median FTSE 250 CEO base salary is higher, but increased at a lower rate than between 2013 and 3.
10 Year on year change in reported median CEO base salary (by FTSE segment)Fixed paydecrease in FTSE 100 CEO median salary since 2012/13 900,000 800,000 700,000 600,000 500,000 400,000 300,000 200,000 100,000 0 CEOCFOO ther DirectorsFTSE 250 BottomFTSE 250 TopFTSE 250 FTSE 100 FTSE 100 2013/14 to 2014 2012/13 to 2013 Year on year changeInto focus | FTSE 350 Executive and Board remuneration report6 Fixed paySalary increasesOverall the median of the increase, from 2013/14 to 2014/15, in salaries paid to executives ranged from to 3%, with the median of CEO increases lower than the other two 4: Year on year (2013/14 to 2014/15) change in FTSE 350 directors base salary paid (by FTSE segment)According to reported salary levels for 2015/16, base salary increases continue to be modest for Executive directors in FTSE 350 companies. Overall, lower or the same median increases in base salary were seen in 2015/16 compared to 2014/15.