Transcription of Fusing Currents in Traces - UltraCAD Design, Inc Homepage
1 Fusing Currents in Traces Douglas Brooks, PhD President, UltraCAD design , Inc. with Dr. Johannes Adam President, ADAM Research Copyright, 2015 (Revision 1, July, 2015) (See Note 8) For a complete analysis of trace and via Currents and temperatures, see Brooks and Adam, PCB trace and Via Currents and Temperatures: The Complete Analysis, Available at , At the end of a seminar one of the authors was leading one day, a participant asked the following question: If there is a catastrophic failure of my system, a certain 1 Oz. trace will carry 40 Amps. I need it to carry that for 1 second while the system shuts down in a controlled manner. What size trace do I need? The first person usually credited with exploring this type of problem was Sir W. H. Preece back in the 1880 s. He was then a consulting engineer for the British General Post Office. At that time the Post Office was responsible for the telegraph (and later wireless telegraph) system in England.
2 Preece was concerned with the effects of lightning strikes on telegraph systems and was searching for the best material and size for a fuse application. He published three papers [1] in the Proceedings of the Royal Society of London in the 1880 s that formed the basis for his famous equation: I = a * d3/2 [Eq. 1] where d is the diameter of the wire in inches, a is a constant (10244 for copper), and I is the Fusing current in Amps. A little algebra transforms this equation to: I = 12277*A3/4 [Eq. 2] where A is the cross-sectional area in square inches. A problem (for us) with Preece s equation is that there is no variable for time. Around the 1920 s (we believe) I. M. Onderdonk developed his equation that does incorporate time. As far as we can determine, Onderdonk never published his work under his own name. The earliest reference we know of is one by E. R. Stauffacher in 1928 [2]. In it he refers to Onderdonk s equation as: 21033log1274 ITSA [Eq.]
3 3] where T is the change in temperature from an ambient temperature = 40 oC. There are later publications which refer to Onderdonk s equation in a more general form: 21033log1234 ITSATa [Eq. 4] where: I = the current in Amps A = the cross-sectional area in circular mils (note 1) S = the time in seconds the current is applied T = the rise in temperature from the ambient or initial state (see note 2) Ta = the reference temperature in degrees C We believe the problem motivating Onderdonk was the one described in Stauffacher s paper. Under certain conditions of dust or moisture, an arc (short circuit) may develop across an insulator supporting a high-voltage power transmission line. The wires supporting the poles and insulators must be able to carry this short-circuit current for sufficient time for the automated equipment to clear the line. In this paper we are going to look at the question of trace Fusing Currents using Onderdonk s equation and also some thermal simulation models of Traces using software developed by one of the authors.
4 Johannes Adam has written a thermal simulation program [3] [7] called TRM (Thermal Risk Management.) It was originally conceived and designed to analyze temperatures across a circuit board, taking into consideration the complete trace layout with optional Joule heating as well as various components and their own contributions to heat generation. The program has been adapted for use in modeling individual Traces under a variety of conditions. The authors have written two other papers [3] and [4] that provide important background information for this paper. In the first, trace Currents and Temperatures Revisited, they look at the trace current /temperature relationships as reported in IPC 2152 [5] and then develop some equations that fit those curves. Then they develop some thermal simulation models that validate the IPC curves and equations, which then provide the basis for further explorations. This paper extends that thermal model exploration further into the question of high temperatures and Fusing Currents .
5 An understanding of the material in that article will be very helpful in understanding the results described in this paper. In their second article, the authors provide further detail about Preece and Onderdonk, including access to some other source documents. Then, in the absence of any apparent source documents for Onderdonk himself, they provide a derivation of Onderdonk s equation. Fusing Time and Temperature: It is important to understand what we mean by Fusing temperature. The term is often used somewhat carelessly. When we apply current to a trace , the trace heats up. This is because of the I2R power dissipated in the trace . This heat raises the temperature of the trace . When sufficient heat is applied to a copper trace (or indeed, any material) to melt the trace , there are two times that need to be considered. The first, t1, is the time to raise the trace from the ambient temperature (see again note 2) to the melting temperature of the trace .
6 The second, t2, is the time to actually melt the trace , to convert it from a solid to a liquid. The amount of heating provided during t2 is referred to as the heat of fusion (note 3.) Even if the trace is beginning to melt, current may flow through the liquid copper. However, liquid copper has a lower electrical and thermal conductivity than does solid copper. Therefore, once the liquid starts to form, there may be an explosive run-away condition that follows. The circuit will break ( current will stop flowing) only if the liquid path separates. This may do so as a result of gravity, as a result of constricting surface tension, or as a result of explosive splattering. Therefore, if we consider time t2 to be the time the circuit path opens, that can depend on many subtle variables. Even a casual reading of Preece s material makes it clear he is referring to time t1 in his experiments. Onderdonk s equation also only refers to time t1, even though some of the sources ( Stauffacher) carelessly refer to the short-time current required to melt copper conductors.
7 (Emphasis added.) When current is applied to a trace , the trace heats up because of the I2R heating effects. But at the same time, the trace cools by conduction, convection, and radiation. A stable temperature is reached when the heating effects exactly equal the cooling effects. Preece slowly raised the current in his experiments until the wire began to glow. Thus there would have been significant cooling effects going on. But that doesn t matter to us because he didn t include as time variable into his results. Onderdonk s equation, on the other hand, was derived analytically and explicitly ignores any cooling effects (from conduction, convection, or radiation). Thus his equation is only valid for the first few seconds of time. Sources typically say that Onderdonk s equation is not valid after 10 seconds. But Adam has suggested that the cooling effects can affect the results in as little as one or two seconds [6].
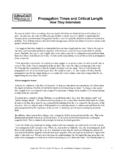
8 In this paper the term Fusing time refers to time t1, the time for the copper to heat to the melting temperature ( Fusing temperature, 1083 oC). Assumptions and Cautions: In this paper we are talking about the Fusing temperature of PCB Traces . We are not talking about fuses per se. So, for example, we are not talking about a commercial fuse of the type shown in Figure 1(a) nor are we talking about forming a fuse link along a PCB trace of the type shown in Figure 1(b) (although the principles we explore here probably apply equally well to Figure 1(b).) Nor are we talking about an insulated wire. Instead, we are talking about standard PCB Traces of uniform width and uniform thickness over their entire length. Figure 1 Types of fuses we are not considering (note 4) In our previous paper [3] we described how to create a thermal model of a PCB trace and run a simulation with the TRM software. Two of the models we developed in that paper we continue to use here.
9 One is a model of a 6 section of a 12 trace configured to simulate the IPC testing fixture (note 5). This model is used to check our results, as described below. The other model is of a simple 6 trace on a substrate, with pads on each end. This model is referred to in our graphs as TRM trace . These models range in thickness from 1 Oz. to 2 Oz., and in width from 20 mil to 200 mil. The trace model is placed on a 63 mil thick FR4 substrate. We also developed a new model for this paper we call TRM Fuse. It is a solid strip of copper, 200 mil long. It also varies in width from 20 to 200 mil and in thickness from 1 to 2 Oz. There is no substrate under this trace . You might envision it as a trace segment placed over a hole drilled in the board substrate material. Thermal Model of a Fuse: Before we look at some thermal simulations, let s convert Onderdonk s equation into a more comfortable format. We can start with Equation [4] and solve for time: 2101log1 * [Eq.]
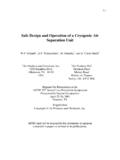
10 5] In this equation, A is still in units of circular mils. If we assume a reference temperature of 20 oC, a Fusing temperature of 1083 oC, and convert this to square mils, the result is: t = .0346*(A/I)2 [Eq. 6] We ran simulations of our fuse model and compared the results with Onderdonk s equation. Onderdonk s equation applies to a bare conductor under adiabatic conditions. That is, without the transfer of any heat into the surroundings. Since TRM is not designed to model a single layer structure, we modeled a copper PCB fuse as shown in Figure 2. Both conductor layers are copper; there is no dielectric layer. The heat Exchange Coefficient (see [3]) was set to zero, but setting it to 10 had negligible effect on the simulation model results. There is a subtle detail involved in running a simulation of this type. In order to get a precise measure of Fusing time, the model needs to run for a period of time, calculate the temperature of the copper, adjust the resistivity of the copper to the new temperature, and then run the simulation for the next period of time.