Transcription of Future population and water demand - Home | Texas Water ...
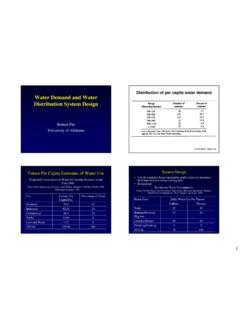
1 Chapter 5 S Water for Texas2017 State Water PlanTexas Water Development Board5 Future populationand Water demandTexas Water Development Board S 2017 State Water PlanChapter 5 49 Water for Texas S Future population and Water demandTexas population is expected to increase more than 70 percent between 2020 and 2070, from million to 51 half of all the statewide population growth between 2020 and 2070 is expected to occur within Regions C and demand is projected to increase by 17 percent, from million acre-feet per year in 2020 to million acre-feet per year in factsThe five-year Water planning cycle begins with projecting the population of Texas over the next 50 years and the Water supply that the population will need to live and work in both cities and rural areas. Determining projections and Water demand is a lengthy process designed to develop a consensus between state agencies, regional Water planning groups, and local entities.
2 The TWDB, the Texas Commission on Environmental Quality, the Texas Department of Agriculture, the Texas Parks and Wildlife Department, representatives from the planning groups, and members of the public helped determine the final projections using initial projections developed by the Office of the State Demographer and the Texas State Data population projectionsTexas population is the second largest in the United States and has increased more than any other state since 2000 ( Census Bureau, 2011, 2014). With its population expected to increase more than 70 percent between 2020 and 2070, from million to 51 million (Figure , Table ), Texas will continue to be one of the fastest growing states in the nation. Although the state-wide population will increase over those 50 years, not all regions will grow plan projects the population for over 1,600 population centers, including cities with more than 500 residents, utilities in unincorporated areas with annual Water use in 2010 of 280 acre-feet or more, and unincorporated populations residing in sparsely populated rural areas within each county.
3 Of the 16 regional Water planning areas, 9 are expected to grow by more than 50 percent between 2020 and 2070, including those with many of the state s major metropolitan areas (Table ).Figure - Projected population in Texas20202030204020502060207060,000,0005 0,000,00040,000,00030,000,00020,000,0001 0,000,00002017 State Water Plan S Texas Water Development Board50 Chapter 5 Future population and Water demand S Water for TexasTable - Projected population by regionRegion202020302040205020602070 Percent growthA419,000461,000504,000547,000592,0 00639,00053B206,000214,000219,000223,000 226,000229,00011C7,504,0008,649,0009,909 ,0 0 011,260,00012,742,00014,348,00091D831,00 0908,000989,0001,089,0001,212,0001,370,0 0065E954,0001,086,0001,208,0001,329,0001 ,444,0001,551,00063F701,000767,000825,00 0885,000944,0001,003,00043G2,371,0002,72 1,0003,097,0003,495,0003,918,0004,351,00 084H7,325,0008,208,0009,025,0009,868,000 10,766,00011,743,00060I1,152,0001,234,00 01,310,0001,389,0001,470,0001,554,00035J 141,000154,000163,000171,000178,000185,0 0031K1,737,0002,065,0002,382,0002,658.
4 0002,928,0003,243,00087L3,001,0003,477,0 003,920,0004,336,0004,770,0005,192,00073 M1,961,0002,379,0002,795,0003,212,0003,6 26,0004,029,000105N615,000662,000693,000 715,000731,000745,00021O540,000594,00064 6,000698,000751,000802,00049P50,00052,00 053,00054,00055,00056,00012Te x a s29,508,00033,631,00037,738,00041,929,00 046,353,00051,040,00073 population growth is concentrated in the east-ern portion of Texas and along the Interstate Highway-35 corridor (Figure ). Of Texas 254 counties, 30 are projected to at least double in population between 2020 and 2070. The same is true for 328 population centers. Nine counties are expected to triple in population between 2020 and 2070. One, Bastrop County, is expected to quadru-ple in population over that time. Regions C (which includes the Dallas-Fort Worth metropolitan area) and H (which includes the Houston metropolitan area) account for more than half of the total pro-jected statewide population growth between 2020 and 2070 (Figure ).
5 Region M, which stretches along the Rio Grande, has the highest regional growth rate and is expected to more than double its population . Conversely, 22 counties and 111 population centers in Texas are expected to lose residents or have no population population methodologyPopulation projections for the 2017 State Water Plan were created using a standard demographic methodology known as a cohort-component model. This procedure uses separate cohorts (combinations of age, gender, and racial-ethnic groups) and components of cohort change (birth, survival, and migration rates) to estimate Future county populations. The cohort-component model and demographic assumptions used as the basis for the regional population projections were developed by the State Demographer at the Texas State Data Center, which provided the TWDB with initial, 30-year projections for each county as a whole. The TWDB then extended these 30-year projections to the state Water plan s 50-year planning the three components of cohort change (birth, survival, and migration rates), migration rates, which calculate how many people move in and out of the counties, are the most critical.
6 While birth and survival rates tend to closely follow historical trends, migration rates tend to be heavily influenced by the state of the economy, reflecting movement that results from economic opportunity. Migration can also be influenced by other unforeseen events, such as catastrophic weather Water Development Board S 2017 State Water PlanChapter 5 51 Water for Texas S Future population and Water demandTo determine the most appropriate migration projection for each region, the TWDB and the planning groups together evaluated three sets of projections based on different migration patterns: Zero migration One-half of the migration rates from 2000 to 2010 2000 2010 migration ratesThe one-half migration scenario was used for the vast majority of counties, based on historical precedence and recommendations by the State Demographer for long-term detailed cohort-component data is avail-able only for the population projections of whole counties, the TWDB had to determine subcounty level projections for cities, other utility service areas, and the remaining rural areas within each TWDB based these initial subcounty pro-jections on the estimated share each entity had Figure - Projected population growth in Texas counties69454544403735353530272020101010 2> 200 increase100 200 increase10 100 increase< 10 increaseInterstate highwaysPopulation growth rate 2020 to 2070(percent change)
7 2017 State Water Plan S Texas Water Development Board52 Chapter 5 Future population and Water demand S Water for TexasFigure - Regional shares of statewide population growth (2020 2070)Region C32%Region H20%Region M10%Region L10%Region G9%Region K7%RegionsA, B, D , E, F , I, J, N, O , P12%Table - Projected annual Water demand by Water use category (acre-feet)Category202020302040205020602 070 Percent changeIrrigation9,438,000 9,138,000 8,800,000 8,431,000 8,067,000 7,778,000 -18 Municipal 5,200,000 5,791,000 6,404,000 7,042,000 7,719,000 8,433,000 62 Manufacturing 2,177,000 2,489,000 2,644,000 2,778,000 2,900,000 3,030,000 39 Steam-electric953,000 1,108,000 1,225,000 1,388,000 1,561,000 1,740,000 83 Livestock296,000 305,000 309,000 315,000 320,000 325,000 10 Mining343,000 354,000 327,000 303,000 287,000 292,000 -15Te x a sa18,407,000 19,185,000 19,709,000 20,257,000 20,854,000 21,598,000 17a Statewide totals may vary between tables due to an entire county s growth from 2000 to 2010.
8 The TWDB then applied that same percent-age to growth projections. However, when the growth trend for a county and a city went in oppo-site directions, other methods of projections more specific to the situation were used. Because census populations were not available for utility service areas, the TWDB used the number of Water connections and populations served that were reported in the TWDB s annual Water Use Survey to represent the baseline population draft projections were then sent to the planning groups for review by planning group members and the public. After requests from the planning groups, the TWDB made more than 600 population projection revisions at the county and subcounty Water Development Board S 2017 State Water PlanChapter 5 53 Water for Texas S Future population and Water Water demand projectionsProjecting Water demand is the second task undertaken to begin the Water planning process.
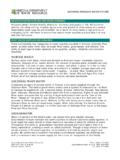
9 The TWDB projects Water demand for municipal and non-municipal sectors of the Texas economy, including manufacturing, mining, steam-electric, livestock, and irrigation. Water demand in all Water use categories is projected to increase by 17 percent, from million acre-feet in 2020 to million acre-feet in 2070 (Figure ).Steam-electric, municipal, and manufacturing categories show the greatest projected increases in Water demand , ranging from approximately 83 percent to 39 percent. Mining is expected to decline, and livestock is expected to grow slightly. While irrigation is the largest Water demand category for 2020, it is expected to decrease 18 percent by 2070. Municipal demand is projected to exceed irrigation demand in that decade (Table , Figure ). Water demand projections exclude Water demands that are associated with purely saline supplies, much of which is associated with indus-trial uses located along the Projected Water demand by region and Water use categoryAs with population projections, total Water demand varies significantly by planning area (Table ).
10 Significant increases in Water demand are pro-jected in Regions C, D, G, H, I, L, and N, each with more than 30 percent growth in projected Water demand between 2020 and of declining irrigation demand , four regions show a projected decrease in total Water demand from 2020 to 2070: Regions A, B, O, and P. More than half of the projected Water demand in 2020 is associated with irrigation use, while less than a third is associated with municipal demand (Figure ). By 2070, the share of statewide Water demand associated with irrigation declines to just more than one-third of the total, offset by increases in municipal, steam-electric, and manu-facturing demand (Figure ). Water demand methodologyIn a process similar to projecting Future population , the TWDB, the Texas Commission on Environmental Quality, the Texas Department of Agriculture, and the Texas Parks and Wildlife Department drafted Figure - Projected annual Water demand in Texas (acre-feet)20202030204020502060207025,00 0,00020,000,00015,000,00010,000,0005,000 ,00002017 State Water Plan S Texas Water Development Board54 Chapter 5 Future population and Water demand S Water for TexasFigure - Projected annual Water demand by Water use category (acre-feet)20202030204020502060207010,00 0,0009,000,0008,000,0007,000,0006,000,00 05,000,0004,000,0003,000,0002,000,0001,0 00,0000Ir rigationMunicipalMan ufacturingSteam-electricLiv estockMiningwater demand projections for the municipal, manufacturing, steam-electric, mining, livestock, and irrigation Water use categories.