Transcription of G1849 Air Properties: Temperature and Relative Humidity
1 Know how. Know now. University of Nebraska Lincoln Extension, Institute of Agriculture and Natural ResourcesG1849 Air Properties: Temperatureand Relative Humidity David P. Shelton, Extension Agricultural EngineerLearn how to use a simplified psychrometric chart to better understand the relationships between air Temperature and Relative Humidity . Air is a vital component of our everyday lives. Air properties are important whether we are ventilating a livestock housing unit, drying grain, or determining Relative Humidity in the home. In a livestock building, Temperature , moisture, odors, and toxic or noxious gases must be controlled. Since the moisture holding ca-pacity of air increases as Temperature increases, heat may be added in grain drying to help remove moisture from the grain kernel.
2 In the home, moisture either can be added to or removed from the air to change the Relative Humidity . In each case, air provides the link between the controls and the mechanical equipment, and air properties influence the results of the processes. Psychrometrics refers to the properties of moist air. A psy-chrometric chart graphically illustrates the relationships between air Temperature and Relative Humidity as well as other properties. A better understanding of air properties and the psychrometric chart can aid in the selection and management of a livestock building ventilation system, a grain drying system, or a home humidifier. Definitions of AirThree primary definitions are used to describe air under various conditions: Atmospheric air contains nitrogen, oxygen, carbon dioxide, water vapor, other gases, and miscellaneous contaminants such as dust, pollen, and smoke.
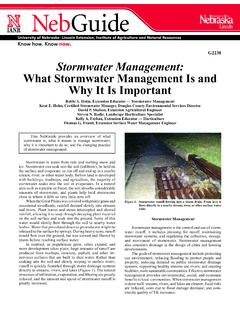
3 This is the air we breathe and use for ventilation. Dry air exists when all of the contaminants and water vapor have been removed from atmospheric air. By volume, dry air contains about 78 percent nitrogen, 21 percent oxygen, and 1 percent other gases. Dry air is used as the reference in psychrometrics. Moist air is a mixture of dry air and water to the variability of atmospheric air, the terms dry air and moist air are used in psychrometrics. For practical purposes, moist air and atmospheric air can be considered equal under the range of conditions normally encountered. The Psychrometric Chart At first glance, even a simple psychrometric chart appears complex (Figure 1). However, separating the various lines and scales on the chart simplifies understanding of their location, meaning, and use.
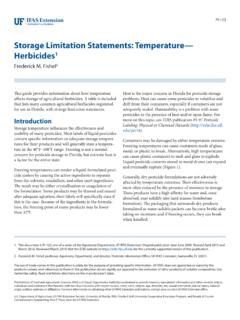
4 Air TemperatureAir Temperature is a measure of the heat content of air. Three different Temperature measurements are used in the psy-chrometric chart: 1. Dry bulb Temperature is the air Temperature determined by an ordinary thermometer. Dry bulb Temperature is given in weather reports. The dry bulb Temperature scale is located at the base of the chart. Vertical lines indicate constant dry bulb Temperature (Figure 2). 2. Wet bulb Temperature reflects the cooling effect of evaporating water. This effect is often used to cool livestock buildings and some homes, and is the cooling process when we perspire. Wet bulb Temperature can be determined by passing air over a thermometer that has been wrapped with a small amount of moist cloth. The cooling effect of the evaporating water causes a lower Temperature compared to the dry bulb air Temperature .
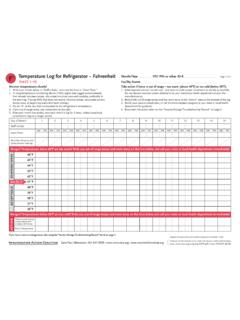
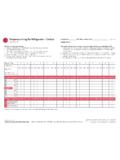
5 The wet bulb Temperature scale is located along the curved upper left portion of the chart. The sloping lines indicate equal wet bulb temperatures (Figure 3). 3. Dew point Temperature is the Temperature below which moisture will condense out of air. Air that is holding as much water vapor as possible is saturated or at its dew point. Water will condense on a surface, such as a building wall or pitcher of ice water, that is at or below the dew point Temperature of the air. The dew point Temperature scale is located along the same curved portion of the chart as the wet bulb Temperature scale. However, horizontal lines indicate equal dew point temperatures (Figure 4). Relative HumidityAs the name implies, Relative Humidity is a measure of how much moisture is present compared to how much moisture the air could hold at that Temperature .
6 Relative Humidity , which is expressed as a percent, is given in weather reports. Lines representing conditions of equal Relative humidities sweep from the lower left to the upper right of the psychrometric chart. The 100 percent Relative Humidity (saturation) line corresponds to the wet bulb and the dew point Temperature scale line. The line for zero percent Relative Humidity falls along the dry bulb Temperature scale line (Figure 5). ExamplesThe versatility of the psychrometric chart lies in the fact that by knowing just two properties of moist air, the other properties can be determined. The following examples will help show how the chart is used. Example 1 Question: Moist air is at 80oF (dry bulb) and 50 percent Relative Humidity . What are the other proper-ties of this air?
7 Answer: First locate the intersection of the 80oF dry bulb Temperature line and the 50 percent rela-tive Humidity line. From this intersection, follow the Figure 1. Simplified psychrometric chart for temperatures and Relative humidities. 8070605040 Wet Bulb and Dew Point Temperature , oFRelative Humidity , %100 90 80 70 60 50 40 3020100 40 50 60 70 80 90 100 110 Dry Bulb Temperature , oF 40 50 60 70 80 90 100 110 Dry Bulb Temperature , oFFigure 2. Dry bulb Temperature lines. appropriate lines to the correct scales (Figure 6). Table I lists the determined properties. Table I. Summary of air properties for Example ValueDry bulb Temperature (given) 80oFRelative Humidity (given) 50%Wet bulb Temperature 67oFDew point Temperature 59oFExample 2 Question: The air in a swine nursery building has a dry bulb Temperature of 80oF and is at 70 percent Relative Humidity .
8 How warm do the walls have to be to prevent condensation? Answer: In this example, we need to know the dew point Temperature . Locate the intersection of the 80oF dry bulb Temperature line and the 70 percent Relative Humidity line. Proceed horizontally to the left until the dew point Temperature scale is intersected. This gives the dew point Temperature as 69oF. The wall temperatures must be warmer than this to prevent condensation. Example 3 Question: A swine producer is considering install-ing evaporative cooling in a breeding herd building. What is the lowest Temperature that can theoretically be obtained from the air coming off the cooling pads if the outside air has a 90oF dry bulb Temperature and 35 percent Relative Humidity ? Answer: Locate the intersection of the 90oF dry bulb Temperature line and the 35 percent Relative Humidity line (which is not shown on the chart, but is midway between the 30 and 40 percent lines).
9 Since evaporative cooling is the same process that determines wet bulb Temperature , follow the wet bulb Temperature line upward and to the left until the wet bulb Temperature scale is intersected. The lowest pos-sible Temperature for these conditions would be the wet bulb Temperature of 69oF. However, due to the inefficiency of evaporative coolers, the Temperature of the air coming off the cooling pads will be 3o-5oF above the wet bulb Temperature . This producer can probably expect to obtain air at about 73oF from the evaporative cooler under these conditions. This air would also have a Relative Humidity of approximately 85 percent. Example 4 Question: How can a homeowner check the home s Relative Humidity in order to adjust a humidifier? Answer: Relative Humidity can be deter mined by using a sling psychrometer to measure wet and dry bulb temperatures and a psychrometric chart.
10 Figure 3. Wet bulb Temperature lines. 40 Wet Bulb Temperature , oF50607080 Figure 5. Relative Humidity lines. 100%80%60%40%20% 0%Figure 4. Dew point Temperature lines. 40 Dew Point Temperature , oF50607080A sling psychrometer consists of two thermometers , one of which is equipped with a wick around the bulb. The other is used to measure dry bulb Temperature . To use this instrument, the wick is saturated with clean water and the psychrometer is whirled for approximately 10 to 15 seconds. Repeat this process two or three times until there is no further Temperature drop on the thermometer with the wick. At this point, the wet bulb Temperature (on the thermometer equipped with a wick) is noted to be 47oF. The dry bulb Temperature thermometer reads 70oF.