Transcription of GARCH 101: An Introduction to the Use of ARCH/GARCH …
1 1 GARCH 101: An Introduction to the Use of ARCH/GARCH models in Applied Econometrics Robert Engle Robert Engle is the Michael Armellino Professor of Finance, Stern School of Business, New York University, New York, New York, and Chancellor s Associates Professor of Economics, University of California at San Diego, La Jolla, California. ABSTRACT ARCH and GARCH models have become important tools in the analysis of time series data, particularly in financial applications. These models are especially useful when the goal of the study is to analyze and forecast volatility. This paper gives the motivation behind the simplest GARCH model and illustrates its usefulness in examining portfolio risk. Extensions are briefly discussed.
2 2 The great workhorse of applied econometrics is the least squares model. This is natural because applied econometricians are typically called upon to determine how much one variable will change in response to a change in some other variable. Increasingly however, econometricians are being asked to forecast and analyze the size of the errors of the model. In this case the questions are about volatility and the standard tools have become the ARCH/GARCH models. The basic version of the least squares model assumes that, the expected value of all error terms when squared, is the same at any given point. This assumption is called homoskedasticity and it is this assumption that is the focus of ARCH/GARCH models.
3 Data in which the variances of the error terms are not equal, in which the error terms may reasonably be expected to be larger for some points or ranges of the data than for others, are said to suffer from heteroskedasticity .. The standard warning is that in the presence of heteroskedasticity , the regression coefficients for an ordinary least squares regression are still unbiased, but the standard errors and confidence intervals estimated by conventional procedures will be too narrow, giving a false sense of precision. Instead of considering this as a problem to be corrected, ARCH and GARCH models treat heteroskedasticity as a variance to be modeled. As a result, not only are the deficiencies of least 3squares corrected, but a prediction is computed for the variance of each error term.
4 This turns out often to be of interest particularly in finance. The warnings about heteroskedasticity have usually been applied only to cross sectional models, not to time series models. For example, if one looked at the cross-section relationship between income and consumption in household data, one might expect to find that the consumption of low-income households is more closely tied to income than that of high-income households, because the dollars of savings or deficit by poor households are likely to be much smaller in absolute value than high income households. In a cross-section regression of household consumption on income, the error terms seem likely to be systematically larger in absolute value for high-income than for low-income households, and the assumption of homoskedasticity seems implausible.
5 In contrast, if one looked at an aggregate time series consumption function, comparing national income to consumption, it seems more plausible to assume that the variance of the error terms doesn t change much over time. A recent development in estimation of standard errors, known as robust standard errors, has also reduced the concern over heteroskedasticity . If the sample size is large, then robust standard errors give quite a good estimate of standard errors even with heteroskedasticity . If the sample is small, the need for a heteroskedasticity correction that doesn t 4affect the coefficients, and only asymptotically corrects the standard errors, can be debated. However, sometimes the natural question facing the applied econometrician is the accuracy of the predictions of his model.
6 Thus the key issue is the variance of the error terms and what makes them large. This question often arises in financial applications where the dependent variable is the return on an asset or portfolio and the variance of the return represents the risk level of those returns. These are time series applications, but it is nonetheless likely that heteroskedasticity is an issue. Even a cursory look at financial data suggests that some time periods are riskier than others; that is, the expected value of the magnitude of error terms at some times is greater than at others. Moreover, these risky times are not scattered randomly across quarterly or annual data. Instead, there is a degree of autocorrelation in the riskiness of financial returns.
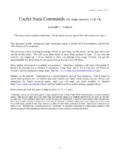
7 Financial analysts, looking at plots of daily returns such as in Figure 1, notice that the amplitude of the returns varies over time and describe this as volatility clustering. The ARCH and GARCH models, which stand for autoregressive conditional heteroskedasticity and generalized autoregressive conditional heteroskedasticity , are designed to deal with just this set of issues. They have become widespread tools for dealing with time series heteroskedastic models. The goal of such models is to provide a volatility measure like a 5standard deviation -- that can be used in financial decisions concerning risk analysis, portfolio selection and derivative pricing. ARCH/GARCH Models Because this paper will focus on financial applications, we will use financial notation.
8 Let the dependent variable be labeled tr, which could be the return on an asset or portfolio. The mean value m and the variance h will be defined relative to a past information set. Then, the return r in the present will be equal to the mean value of r (that is, the expected value of r based on past information) plus the standard deviation of r (that is, the square root of the variance) times the error term for the present period. The econometric challenge is to specify how the information is used to forecast the mean and variance of the return, conditional on the past information. While many specifications have been considered for the mean return and have been used in efforts to forecast future returns, virtually no methods were available before the Introduction of ARCH models.
9 The primary descriptive tool was the rolling standard deviation. This is the standard deviation calculated using a fixed number of the most recent observations. For example, this could be calculated every day using the most recent month (22 days) of data. It is convenient to think of this as the first ARCH model; it assumes that the variance of tomorrow s return is an equally 6weighted average of the squared residuals from the last 22 days. The assumption of equal weights seems unattractive as one would think that the more recent events would be more relevant and therefore should have higher weights. Furthermore the assumption of zero weights for observations more than one month old, is also unattractive.
10 The ARCH model proposed by Engle(1982) let these weights be parameters to be estimated. Thus the model allowed the data to determine the best weights to use in forecasting the variance. A useful generalization of this model is the GARCH parameterization introduced by Bollerslev(1986). This model is also a weighted average of past squared residuals but it has declining weights which never go completely to zero. It gives parsimonious models which are easy to estimate and even in its simplest form, has proven surprisingly successful in predicting conditional variances. The most widely used GARCH specification, asserts that the best predictor of the variance in the next period is a weighted average of the long run average variance, the variance predicted for this period and the new information this period which is the most recent squared residual.