Transcription of GBD PROFILE: CANADA - Institute for Health Metrics …
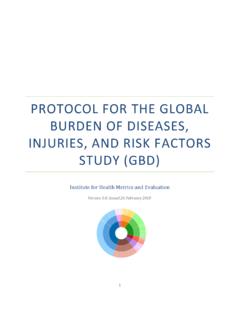
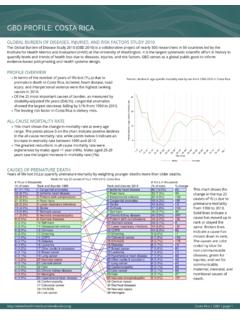
1 GLOBAL BURDEN OF DISEASES, INJURIES, AND RISK FACTORS STUDY 2010 The Global Burden of Disease Study 2010 (GBD 2010) is a collaborative project of nearly 500 researchers in 50 countries led by theInstitute for Health Metrics and Evaluation (IHME) at the University of Washington. It is the largest systematic scientific effort in history toquantify levels and trends of Health loss due to diseases, injuries, and risk factors. GBD serves as a global public good to informevidence-based policymaking and Health systems OVERVIEWlIn terms of the number of years of life lost (YLLs) due topremature death in CANADA , ischemic heart disease, trachea,bronchus, and lung cancers, and cerebrovascular disease werethe highest ranking causes in the 25 most important causes of burden, as measured bydisability-adjusted life years (DALYs), road injury showed thelargest decrease, falling by 31% from 1990 to leading risk factor in CANADA is dietary MORTALITY RATElThis chart shows the decline in mortality rate at every age higher points on the chart indicate that declines in mortalityrates were faster in those age groups between 1990 and greatest reductions in all-cause mortality rate wereexperienced by females aged 5-9 years (51%).
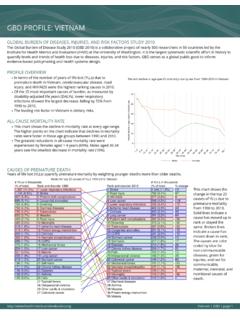
2 Females aged 80+years saw the smallest decrease in mortality rate (10%).Percent decline in age-specific mortality rate by sex from 1990-2010 in CanadaCAUSES OF PREMATURE DEATHY ears of life lost (YLLs) quantify premature mortality by weighting younger deaths more than older chart shows thechange in the top 25causes of YLLs due topremature mortalityfrom 1990 to lines indicate acause has moved up inrank or stayed thesame. Broken linesindicate a cause hasmoved down in causes are colorcoded by blue fornon-communicablediseases, green forinjuries, and red forcommunicable,maternal, neonatal, andnutritional causes PROFILE: | GBD | page 10153045 Percent decline in age specific mortality rate 1 45 910 1415 1920 2425 2930 3435 3940 4445 4950 5455 5960 6465 6970 7475 7980+Age groupMalesFemales# YLLs in thousands(% of total)Rank and disorder 1990 Rank and disorder 2010# YLLs in thousands(% of total)% change35 ( )22 Alzheimers disease43 ( )20 Brain cancer108 ( )8 Breast cancer113 ( )7 COPD34 ( )23 Chronic kidney disease67 ( )13 Cirrhosis116 ( )6 Colorectal cancer93 ( )9 Congenital anomalies69 ( )12 Diabetes31 ( )25 Falls54 ( )14 HIV/AIDS33 HIV/AIDS34 ( )24 Interpersonal violence29 Interpersonal violence778 ( )1 Ischemic heart disease48 ( )17 Leukemia91 ( )10 Lower respiratory infections294 ( )2 Lung cancer42 ( )21 Non-Hodgkin lymphoma48 ( )16 Other cardio & circulatory54 ( )15 Pancreatic cancer74 ( )11 Preterm birth complications44 ( )18 Prostate cancer200 ( )
3 4 Road injury184 ( )5 Self-harm43 ( )19 Stomach cancer212 ( )3 Stroke127 ( )7 Alzheimers disease27153 ( )19 Brain cancer24114 ( )10 Breast cancer4140 ( )6 COPD2450 ( )21 Chronic kidney disease4979 ( )12 Cirrhosis17145 ( )5 Colorectal cancer2560 ( )16 Congenital anomalies-37120 ( )9 Diabetes7442 ( )23 Falls36660 ( )1 Ischemic heart disease-1653 ( )20 Kidney cancers11431 Kidney cancers55 ( )17 Leukemia1588 ( )11 Lower respiratory infections-5354 ( )2 Lung cancer2161 ( )14 Non-Hodgkin lymphoma4860 ( )15 Other cardio & circulatory2535 ( )25 Ovarian cancer1927 Ovarian cancer75 ( )13 Pancreatic cancer4050 ( )22 Preterm birth complications-3356 ( )18 Prostate cancer25124 ( )8 Road injury-40170 ( )4 Self-harm-938 ( )24 Stomach cancer-13188 ( )3 Stroke-11 Ranks for top 25 causes of YLLs 1990-2010, CanadaCCCommuni cabl e, maternal , neonatal , and nutri ti onalCCNon-communi cabl eCCInj uri es0100,000200,000300,000400.
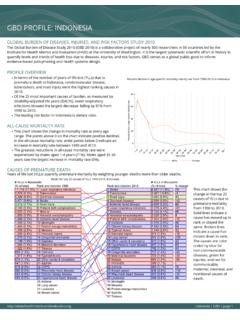
4 000 YLDs0 6 days7 27 days28 364 days1 4 years5 9 years10 14 years15 19 years20 24 years25 29 years30 34 years35 39 years40 44 years45 49 years50 54 years55 59 years60 64 years65 69 years70 74 years75 79 years80+ yearsWar & disasterIntentional injuriesUnintentional injuriesTransport injuriesOther non communicableMusculoskeletal disordersDiabetes/urogen/blood/endoMenta l & behavioral disordersNeurological disordersDigestive diseasesCirrhosisChronic respiratory diseasesCardio & circulatory diseasesCancerOther communicableNutritional deficienciesNeonatal disordersMaternal disordersNTD & malariaDiarrhea/LRI/other infectiousHIV/AIDS & tuberculosisISCHEMIC HEART DISEASELOW BACK PAINLUNG CANCERMAJOR DEPRESSIVE DISORDEROTHER MUSCULOSKELETALSTROKECOPDDIABETESNECK PAINALZHEIMER'S DISEASESELF-HARMROAD INJURYDRUG USE DISORDERSCOLORECTAL CANCERFALLSBREAST CANCERASTHMAANXIETY DISORDERSMIGRAINEOSTEOARTHRITISCHRONIC KIDNEY DISEASEALCOHOL USE DISORDERSSCHIZOPHRENIALOWER RESPIRATORY INFECTIONSCIRRHOSIS12 3 4 5 6 7 8 9 1011 1213 14 15 16 17 18 19 20 21 22 232425-200-150-100-50050100150200 | GBD | page 2 Percent change 1990-2010 YEARS LIVED WITH DISABILITY (YLDs)Years lived with disability (YLDs) are estimated by weighting the prevalence of different conditions based on severity.
5 The top five leadingcauses of YLDs in CANADA are low back pain, major depressive disorder, other musculoskeletal disorders, neck pain, and drug size of the coloredportion in each barrepresents the number ofYLDs attributable to eachcause. The height of each barshows which age groups hadthe most YLDs in 2010. Thecauses are aggregated. Forexample, musculoskeletaldisorders include low backpain and neck YLDs by cause and age 2010 DISABILITY-ADJUSTED LIFE YEARS (DALYs)Disability-adjusted life years (DALYs) quantify both premature mortality (YLLs) and disability (YLDs) within a population. In CANADA , the topthree causes of DALYs in 2010 were ischemic heart disease, low back pain, and trachea, bronchus, and lung cancers. Two causes thatappeared in the 10 leading causes of DALYs in 2010 and not 1990 were diabetes mellitus and Alzheimer's disease and other top 25 causes of DALY sare ranked from left to rightin order of the number ofDALYs they contributed in2010.
6 Bars going up show thepercent by which DALYs haveincreased since 1990. Barsgoing down show the percentby which DALYs havedecreased. Globally,non-communicable diseasesand injuries are generally onthe rise, while communicable,maternal, neonatal, andnutritional causes of DALY sare generally on the causes of DALYs and percent change 1990 to 2010 for | GBD | page 3 1012345678910111213% DALYs attributable to risk factorsLow bone mineral densityIron deficiencyChildhood sexual abuseIntimate partner violenceAmbient PM pollutionOccupational risksDrug useAlcohol useHigh total cholesterolHigh fasting plasma glucosePhysical inactivityHigh blood pressureHigh body mass indexSmokingDietary risksWar & disasterIntentional injuriesUnintentional injuriesTransport injuriesOther non communicableMusculoskeletal disordersDiabetes/urogen/blood/endoMenta l & behavioral disordersNeurological disordersDigestive diseasesCirrhosisChronic respiratory diseasesCardio & circulatory diseasesCancerOther communicableNutritional deficienciesNeonatal disordersMaternal disordersNTD & malariaDiarrhea/LRI/other infectiousHIV/AIDS
7 & tuberculosisAge-standardized death rates, YLL rates, YLD rates, and life expectancy at birth and Health -adjusted life expectancy at birth for 1990 and 2010, both sexes combinedCountryAge-standardized death rate(per 100,000)Age-standardized YLL rate(per 100,000)Age-standardized YLD rate(per 100,000)Life expectancy at birthHealth-adjusted lifeexpectancy at birth19902010199020101990201019902010199 02010 Rate Rank Rate Rank Rate Rank Rate Rank Rate Rank Rate Rank LE Rank LE Rank HALE Rank HALE RankKuwait489151114 11,796 3 12,133 15 12,022 15 11,867 15 States6391151615 15,130 15 11,447 14 10,503 1 10,509 14 11,825 47,071 2 10,663 2 10,807 11,847 5 7,9885 11,355 12 11,492 14,298 12 8,764 9 11,024 5 11,138 11,310 26,6751 10,763 3 11,108 11 Australia56863893 12,381 77,7224 11,153 9 10,979 12,079 6 8,546 8 10,806 4 10,845 3 5 4 Austria62294185 13,732 10 8,401 6 11,052 6 11.
8 381 11 11,196 17,2963 11,378 13 11,250 14,383 13 9,592 13 11,209 11 11,456 13 13 13,458 99,381 12 11,119 8 10,933 10 United Kingdom6381045511 13,452 88,949 10 11,453 14 11,435 12 14,032 11 8,512 7 11,165 10 11,015 14,467 14 9,050 11 11,092 7 11,248 FACTORSO verall, the three risk factors that account for the most disease burden in CANADA are dietary risks , tobacco smoking, and high body-massindex. The leading risk factors for children under 5 and adults aged 15-49 years were zinc deficiency and alcohol use, respectively, graph shows the top 15risk factors for CANADA . Thecolored portion of each barrepresents the specificdiseases attributable to thatrisk factor while bar sizerepresents the percentage ofDALYs linked to specific of disease attributable to 15 leading risk factors in 2010, expressed as a percentage of CANADA DALYsCOUNTRY BENCHMARKING OF BURDEN OF DISEASEU nderstanding the relative performance of CANADA against other comparator countries provides key insight into public Health successesand areas where CANADA might be falling behind.
9 The table identifies CANADA 's rank across 14 other comparator countries, selected andordered by income per capita, for five Metrics of interest, with 1 indicating the best rank and 15 indicating the worst rates are used to make meaningful comparisons across time by adjusting for changes in population size and expectancy incorporates mortality, and Health -adjusted life expectancy further incorporates years lived in less than ideal 2010, CANADA ranked 3rd for age-standardized YLD rate and 8th for age-standardized YLL | GBD | page 4 Ranking of leading age-standardized rates of disability-adjusted life years (DALYs) relative to comparator countries in 1990 CountryKuwait112113141315111511133915131 3114183 United States1211431215138514146515138621108151 01412 Switzerland13441071110141295968612121441 21869 Netherlands36117312814387812122111643462 24 Ireland151191161115141161410851213891459 352 Iceland68724645713131139319711759111 Australia5465111310264312411151541551101 25136 Canada4 7 10 1 7 14 7 4 8 6 10 7 6 4 10 11 5 5 2 6 13 7 6 15 8 Austria810514139671210119771221071322131 1315 Sweden71326251131125429413813699214105 Denmark101413108101461331215145117144125 11415113 Belgium251591549910981013164310108148741 0 United Kingdom131212121212325211151414142148156 104127 Germany915889851197131381071073117311137 14 Finland149315532121515423215911151215312 911 Ranking of leading age-standardized rates of disability-adjusted life years (DALYs)
10 Relative to comparator countries in 2010 CountryKuwait152114115415111156141101211 515110158 United States1411261510151414148131552791521214 10141212 Switzerland23513231291341372414886108456 35 Netherlands17141598104683311461321061632 102 Ireland121084109961159910131111117951074 137 Iceland486731221213418352414810561141 Australia3441132754761213123615111527213 23 Canada7 5 11 5 14 4 6 12 10 12 10 5 12 8 1 10 12 2 5 14 12 4 15 7 6 Austria101171057811821211116135147611123 114 Sweden51328453721011237731381313113954 Denmark614151112141413397109151012754491 41911 Belgium861338121189111414711121533119887 119 United Kingdom912102111113156241410814141314113 9121410 Germany1115997651073564999593713115813 Finland139312613131515158521546112321586 15 Ranking Legend1 - 34 - 78 - 1112 - 15 Ischemic heart diseaseLow back painLung cancerStrokeRoad injuryOther musculoskeletalCOPDM ajor depressive disorderSelf-harmNeck painDiabetesColorectal cancerBreast cancerAnxiety disordersDrug use disordersAsthmaCongenital anomaliesMigraineFallsLower respiratory infectionsAlzheimer's diseasePreterm birth complicationsAlcohol use disordersSchizophreniaCirrhosisIschemic heart diseaseLow back painLung cancerMajor depressive disorderOther musculoskeletalStrokeCOPDD iabetesNeck painAlzheimer's diseaseSelf-harmRoad injuryDrug use disordersColorectal cancerFallsBreast cancerAsthmaAnxiety disordersMigraineOsteoarthritisChronic kidney diseaseAlcohol use disordersSchizophreniaLower respiratory infectionsCirrhosisCOUNTRY BENCHMARKING OF BURDEN OF DISEASE, CONTINUEDThis figure shows the rank of CANADA relative to the same comparator countries for the leading causes of DALYs in 1990 (top) and 2010(bottom).