Transcription of ggmap: Spatial Visualization with ggplot2
1 CONTRIBUTEDRESEARCHARTICLES144ggmap: Spatial Visualization withggplot2by David Kahle and Hadley WickhamAbstractIn Spatial statistics the ability to visualize data and models superimposed with their basicsocial landmarks and geographic context is a new tool which enables suchvisualization by combining the Spatial information of static maps from Google Maps, OpenStreetMap,Stamen Maps or CloudMade Maps with the layered grammar of graphics implementation addition, several new utility functions are introduced which allow the user to access the GoogleGeocoding, Distance Matrix, and Directions APIs. The result is an easy, consistent and modularframework for Spatial graphics with several convenient tools for Spatial data Spatial data in R can be a challenging task. Fortunately the task is made a good deal easierby the data structures and plot methods ofsp,RgoogleMaps, and related packages (Pebesma andBivand, 2006; Bivand et al.)
2 , 2008; Loecher and Berlin School of Economics and Law, 2013). Usingthose methods, one can plot the basic geographic information of (for instance) a shape file containingpolygons for areal data or points for point referenced data. However, compared to specializedgeographic information systems (GISs) such as ESRI s ArcGIS, which can plot points, polygons, top of maps and satellite imagery with drag-down menus, these visualizations can be prettydisappointing. This article details some new methods for the Visualization of Spatial data in R usingthe layered grammar of graphics implementation ofggplot2in conjunction with the contextualinformation of static maps from Google Maps, OpenStreetMap, Stamen Maps or CloudMade Maps(Wickham, 2009, 2010). The result is an easy to use R package namedggmap. After describing the nutsand bolts ofggmap, we showcase some of its capabilities in a simple case study concerning violentcrimes in downtown Houston, Texas and present an overview of a few utility Spatial data in RAreal data is data which corresponds to geographical extents with polygonal boundaries.
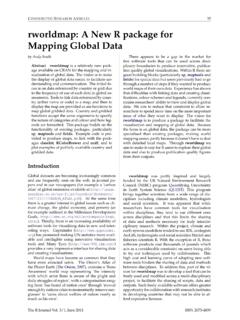
3 A typicalexample is the number of residents per zip code. Considering only the boundaries of the areal units,we are used to seeing areal plots in R which resemble those in Figure 1 (left). 1:A typical R areal plot zip codes in the Greater Houston area (left), and a typical R spatialscatterplot murders in Houston from January 2010 to August 2010 (right).While these kinds of plots are useful, they are not as informative as we would like in many instance, when plotting zip codes it is helpful to also see major roads and other landmarks whichform the boundaries of areal situation for point referenced Spatial data is often much worse. Since we can t easily contextu-alize a scatterplot of points without any background information at all, it is common to add points asThe R Journal Vol. 5/1, June 2013 ISSN 2073-4859 CONTRIBUTEDRESEARCHARTICLES145an overlay of some areal data whatever areal data is available.
4 The resulting plot looks like Figure 1(right).In most cases the plot is understandable to the researcher who has worked on the problem forsome time but is of hardly any use to his audience, who must work to associate the data of interestwith their location. Moreover, it leaves out many practical details are most of the events to the eastor west of landmarkx? Are they clustered around more well-to-do parts of town, or do they tendto occur in disadvantaged areas? Questions like these can t really be answered using these kinds ofgraphics because we don t think in terms of small scale areal boundaries ( zip codes or censustracts).With a little effort better plots can be made, and tools such asmaps,maptools,sp, orRgoogleMapsmake the process much easier; in fact,RgoogleMapswas the inspiration forggmap(Becker et al.,2013; Bivand and Lewin-Koh, 2013).Moreover, there has recently been a deluge of interest in the subject of mapmaking in R IanFellows excellent interactive GUI-drivenDeducerSpatialpackage based on Bing Maps comes tomind (Fellows et al.)
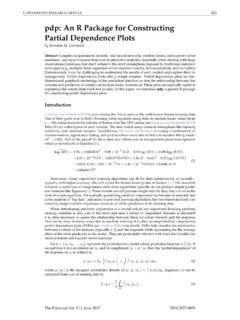
5 , 2013).ggmaptakes another step in this direction by situating the contextualinformation of various kinds of static maps in theggplot2plotting framework. The result is an easy,consistent way of specifying plots which are readily interpretable by both expert and audience andsafeguarded from graphical inconsistencies by the layered grammar of graphics framework. The resultis a Spatial plot resembling Figure 2. Note that map images and information in this work may appearslightly different due to map provider changes over <- subset(crime, offense == "murder")qmplot(lon, lat, data = murder, colour = I('red'), size = I(3), darken = .3)lllllllllllllllllllllllllllllllllllll llllllllllllllllllllllllllllllllllllllll llllllllllllllllllllllllllllllllllllllll llllllllllllllllllllllllllllllllllllllll Figure 2:A Spatial scatterplot based on Stamen Maps terrain tile set made with theqmplotfunction,an experimental amalgamation of the functions presented in this layered grammar of graphicsOne advantage of making the plots withggplot2is the layered grammar of graphics on whichggplot2is based (Wickham, 2010; Wilkinson, 2005).
6 By definition, the layered grammar demands that everyplot consist of five components : a default dataset with aesthetic mappings, one or more layers, each with a geometric object ( geom ), a statistical transformation ( stat ),and a dataset with aesthetic mappings (possibly defaulted), a scale for each aesthetic mapping (which can be automatically generated), a coordinate system, and a facet R Journal Vol. 5/1, June 2013 ISSN 2073-4859 CONTRIBUTEDRESEARCHARTICLES146 Sinceggplot2is an implementation of the layered grammar of graphics, every plot made withggplot2has each of the above elements. Consequently,ggmapplots also have these elements, but certainelements are fixed to map components : thexaesthetic is fixed to longitude, theyaesthetic is fixed tolatitude, and the coordinate system is fixed to the Mercator major theoretical advantage of using the layered grammar in plotting maps is that aestheticscales are kept consistent.
7 In the typical situation where the map covers the extent of the data, inggmapthe latitude and longitude scales key off the map (by default) and one scale is used for thoseaxes. The same is true of colors, fills, alpha blendings, and other aesthetics which are built on top ofthe map when other layers are presented each is allotted one scale which is kept consistent acrosseach layer of the plot. This aspect of the grammar is particularly important for faceted plots in orderto make a proper comparison across several plots. Of course, the scales can still be tricked if the userimproperly specifies the Spatial data, using more than one projection in the same map, but fixingsuch errors is beyond any practical advantage of using the grammar is even better. Since the graphics are done inggplot2the user can draw from the full range ofggplot2 s capabilities to layer elegant visual content geoms,stats, scales, etc.
8 Using the usualggplot2coding conventions. This was already seen briefly in Figure2 where the arguments ofqmplotare identical to that ofggplot2 sqplot; much more will be ggmap worksThe basic idea drivingggmapis to take a downloaded map image, plot it as a context layer usingggplot2, and then plot additional content layers of data, statistics, or models on top of the map. Inggmapthis process is broken into two pieces (1) downloading the images and formatting themfor plotting, done withget_map, and (2) making the plot, done these twofunctions for quick map plotting ( sggplot), andqmplotattempts to wrap up the entireplotting process into one simple command ( sqplot).Theget_mapfunctionInggmap, downloading a map as an image and formatting the image for plotting is done with theget_mapfunction. More specifically,get_mapis a wrapper function for the underlying functionsget_googlemap,get_openstreetmap ,get_stamenmap, andget_cloudmademapwhich accepts a widearray of arguments and returns a classed raster object for plotting the most important characteristic of any map is location, the most important argument ofget_mapis thelocationargument.
9 Ideally,locationis a longitude/latitude pair specifying the centerof the map and accompanied by azoomargument, an integer from 3 to 20 specifying how large thespatial extent should be around the center, with 3 being the continent level and 20 being roughly thesingle building defaulted to downtown Houston, Texas, andzoomto 10, roughly longitude/latitude pairs are ideal for specifying a location, they are somewhat inconvenienton a practical level. For this reason,locationalso accepts a character string. The string, whethercontaining an address, zip code, or proper name, is then passed to thegeocodefunction which thendetermines the appropriate longitude/latitude coordinate for the center. In other words, there isno need to know the exact longitude/latitude coordinates of the center of the map get_mapcandetermine them from more colloquial ( lazy ) specifications so that they can be specified very example, since> geocode("the white house")lon ,"the white house"is a viablelocationargument.
10 More details ongeocodeand other utilityfunctions are discussed at the end of this lieu of a center/zoom specification, some users find a bounding box specification more conve-nient. To accommodate this form of specification,locationalso accepts numeric vectors of length fourfollowing the left/bottom/right/top convention. This option is not currently available for each map source has its own web application programming interface (API), specificationoflocation/zoominget_mapwor ks for each by computing the appropriate parameters (if necessary)1 Note that because of the Mercator projection limitations inmapproject, anything above/below 80 cannot beplotted R Journal Vol. 5/1, June 2013 ISSN 2073-4859 CONTRIBUTEDRESEARCHARTICLES147and passing them to each of the API specificget_*functions. To ensure that the resulting maps arethe same across the various sources for the samelocation/zoomspecification,get_mapfi rst grabs theappropriate Google Map, determines its bounding box, and then downloads the other map as the case of Stamen Maps and CloudMade Maps, this involves a stitching process of combiningseveral tiles (small map images) and then cropping the result to the appropriate bounding box.