Transcription of Global Conflict Trends and their Consequences
1 Global Conflict Trends and their Consequences *. Lars-Erik Cederman and Yannick Pengl ETH Z rich May 21, 2019. This report addresses the evolution of the main types of armed Conflict around the world. The goal is not only to study Trends , but also to pinpoint their drivers and rely on such information to generate scenarios about future developments. Such analysis is then used to study the likely Consequences of Conflict , especially with the United Nations' Sustainable Development Goals (SDGs) in mind. Simply put, the report centers on how to improve the chances of peace (SDG 16). While previous research has highlighted the importance of development for peace, our main argument is that the path to peace goes through inequality, especially among ethnic groups (SDG 10), thus confirming the analysis of the recent report on Pathways for Peace (World Bank and United Nations 2018).
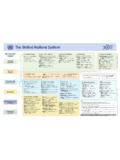
2 In terms of Consequences , our analysis centers on violence and various measures of development, as captured by SDGs 1-9. Throughout this report, we will focus especially on the period from 2015, which represents the end of the previous reporting period, but we will also go further back where appropriate to detect Trends and patterns of Conflict . Highlighting positive outcomes in terms of SDGs, Figure 1 depicts how the main dimensions fit together. As a point of departure, our analysis in the first section of the report centers on the objective of peace. Then we turn to the theme of equality, here viewed as a key driver of peaceful outcomes, in addition to the conventional stress on development. In the third section of the report, we analyze how Conflict put up obstacles to development, broadly measured according to the SDGs 1-9. Development, in turn, feeds back by reinforcing peaceful outcomes.
3 To keep these positive influences in place, our framework highlights how multilateral institutions contribute to all three main components, that is by promoting norms and practices of equality, by directly preventing and reducing Conflict through peacekeeping and other interventions, and finally, by supporting economic and social development (see the dashed arrows). In the fourth section of the paper, we spell out how all these interdependencies produce different Conflict scenarios that can inform future policy making. Figure 1. Conceptual map including relevant SDGs. *. This report has profited from excellent research assistance by Dennis Atzenhofer and Vanessa Kellerhans. 1. 1. Current conflicts Trends We start our analysis by considering the most important types of political violence in today's world. Our investigation relies on the well-established data sources offered by the Uppsala Conflict Data Program (UCDP) (Pettersson and Eck 2018).
4 1 The UCDP defines armed, state- based Conflict in terms of interstate and intrastate conflicts (see Box). Whereas the former pertains to combat between sovereign states, the latter features armed rebellion by non-state actors challenging the sovereignty of incumbent governments within a sovereign state. Intrastate conflicts can contest either the control of the government or control of subnational territory. Below, we will also briefly discuss non-state conflicts that pit non-state actors against each other and one-sided violence, which entails civilian victimization rather than two-sided, armed Conflict . The UCDP uses a threshold of 25 battle deaths as a criterion for inclusion in the dataset. An interstate or civil war is defined as a Conflict that exceeds 1000. battle deaths. Box: Definitions of political violence Armed Conflict : Intrastate/civil Conflict refers to violence between a government and at least one non-governmental party within a sovereign country Interstate Conflict refers to violence between two or more governments.
5 Non-state Conflict refers to the use of armed force between two organized armed groups, neither of which is the government of a state, One-sided violence refers to the use of armed force by the government of a state or by a formally organized group against civilians. See and our graphic illustration in Appendix 6. The first question that needs to be addressed is whether interstate and intrastate Conflict have been trending in recent years, especially since 2015. Figure 2 displays a simple count of these categories since 1946. The graph indicates that interstate conflicts have rarely occurred since the end of WWII. This pattern also maintains for the period since 2015 (see the gray area in the graph), which counts at most two conflicts without any clearly increasing In contrast, internal Conflict has been much more common, not the least because the state system has expanded massively as a consequence of decolonization in the decades following WWII.
6 The frequency of civil Conflict reached its first peak in the early years of the post- Cold War period, followed by a gradual decline. However, this declining trend did not persist until today. After having stabilized in the first decade of the 2000s, the rate of Conflict shot up markedly in the early 2010s, reaching an all-time peak in 2015 and 2016. The final year of observation records a slightly lower rate, however, still around the frequency of the earlier peak in the early 1990s (Petterson and Eck 2018). On the face of it, this trajectory appears to contradict prominent theories of a general decline in Conflict (see Pinker 2011; Goldstein 2011). However, it would be premature to draw any conclusions from a highly aggregated, raw count of Conflict incidence because doing so treats all conflicts as equally important. In fact, conflicts differ significantly in terms of their 1.
7 For other data sources on Conflict , see ACLED (Raleigh et al. 2010). 2. See Appendix 1 for a list of conflicts that were active during the highlighted period. 2. size as counted by the number of people killed. To this effect, we rely on UCDP's count of battle deaths that indicate the number of fatalities as a direct consequence of Figure 2. Armed intrastate and interstate Conflict . Based on both interstate and intrastate Conflict , Figure 3 offers a summary of relevant Trends measured in terms of battle deaths with data drawn from Gleditsch and Clauset (2018). While the time series only dates back to 2013, it captures the beginning of the most recent spike in violence that we referred to in Figure 2. However, this surge of Conflict intensity is dwarfed by the peaks during the Cold War. In this sense, the most recent Conflict trend does not necessarily contradict the general argument that armed Conflict will decline in the long-run.
8 Global Trends mask important variation at the regional level. Figure 4 plots a close-up of the number of battle deaths in interstate and intrastate conflicts into five world regions since 1989. When focusing on the post-Cold War period, there is no decline of Conflict intensity. Fortunately, however, the trend has been sinking rapidly from 2015 through 2017 with levels that remain similar to the two previous peaks of the post-Cold War period. 3. Conflict may also cause more indirect, longer-term fatalities, for instance due to disease and disruptions of livelihoods (see Ghobarah, Huth and Russett 2003, and further references below). 3. Figure 3. Intensity of armed Conflict , 1946 2013. Source: Gleditsch and Clauset (2018) based on data from UCDP and PRIO. Figure 4. Conflict intensity by world region after the end of the Cold War. In the years of the post-Cold War period, Africa witnessed the highest numbers of battle- related deaths followed by Asia.
9 The otherwise much publicized conflicts in the former Yugoslavia and other parts of Europe raged throughout the 1990s, but their levels were generally lower than in the aforementioned continents. From 2012, however, there has been a major explosion of fatalities in the MENA region, mostly driven by the Syrian civil war. 4. Despite its early promise of democratization, the so-called Arab Spring in 2011 further destabilized an already fragile region and paved the way for a series of devastating civil wars that partly followed earlier lines of Conflict (International Crisis Group 2017). Before further analyzing the evolution of armed Conflict , we display the Trends of two other types of political violence: non-state Conflict and one-sided violence. Non-state Conflict captures violence involving only non-state actors, such as communal Conflict and riots (Sundberg, Eck and Kreutz 2012).
10 As opposed to non-state Conflict , one-sided violence describes killings of unarmed victims by an armed organization, whether states or non-state actors (Eck and Hultman 2007). Based on UCDP data covering the period from 1989, Figure 5 shows how non-state Conflict has increased considerably in the run up to and in the aftermath of 2015. In contrast, the count of one-sided violence has described a more stable development, although there has been a slight increase since 2009. Figure 5. The number of non-state conflicts and episodes of one-sided violence. Focusing on intensity, Figure 6 breaks up the non-state Conflict category into five world regions. The surge in non-state Conflict is driven by events in the Middle East and Africa. In 2017, the total casualty numbers for this type of political violence reached almost 14000, which is still well below the total number of battle deaths caused by armed Conflict at about 70000 (Petterson and Eck 2018).