Transcription of Global Investments in R&D - UNESCO
1 Fact Sheet No. 59 June 2020 FS/2020/SCI/59 Global Investments in R&D This fact sheet presents the latest UIS data on research and experimental development (R&D) available as of June 2020. A snapshot of R&D expenditure This fact sheet illustrates Global and regional trends in the allocation of resources to research and experimental development (R&D). The UIS releases data on resources devoted to R&D once every year in June. The most commonly-used indicators to monitor resources devoted to R&D worldwide are gross domestic expenditure on R&D (GERD) expressed in purchasing power parity (PPP$) and R&D intensity (percentage of gross domestic product (GDP) devoted to R&D activities).
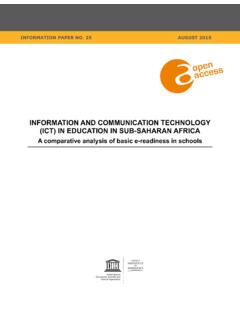
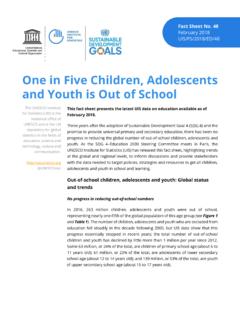
2 Figure 1 presents the distribution of R&D expenditure by region. Figure 1. Regional R&D Investments Shares of world R&D expenditure (GERD) by region, 2011, 2013, 2015 and 2017 Source: UNESCO Institute for Statistics estimates, February 2020. The UNESCO Institute for Statistics (UIS) is the statistical office of UNESCO and is the UN depository for Global statistics in the fields of education, science and technology, culture and communication. @ UNESCO stat 2 UIS Fact Sheet No. 59 | June 2020 Figures 2 and 3 illustrate the distribution of R&D intensity by region.
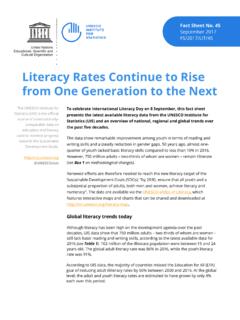
3 This indicator presents R&D expenditure relative to the size of the regional or national economy. Figure 2. R&D intensity by region Gross domestic expenditure on R&D as a percentage of GDP by region, 2011, 2013, 2015 and 2017 Source: UNESCO Institute for Statistics estimates, February 2020. Figure 3. Snapshot of R&D intensity Gross domestic expenditure on R&D as a percentage of GDP, 2018 or latest year available Source: UNESCO Institute for Statistics, June 2020. 3 UIS Fact Sheet No. 59 | June 2020 The 2017 regional averages for the share of GDP devoted to R&D activities are: for North America and Western Europe for East Asia and the Pacific for World for Central and Eastern Europe for Latin America and the Caribbean for Arab States for South and West Asia for sub-Saharan Africa for Central Asia Figure 4 illustrates the world s top leaders in R&D expenditure, measured in PPP$ for the latest year available.
4 PPP$ better reflects the real value of Investments and allows for more comparability by eliminating differences in price levels among countries. Essentially, this means that a sum of money converted into US dollars at PPP rates will buy the same basket of goods and services in all countries. Figure 4. World s top 10 leaders in R&D investment GERD (billion PPP$), 2018 or latest year available Notes: -1 = 2017. Source: UNESCO Institute for Statistics, June 2020. 4 UIS Fact Sheet No. 59 | June 2020 Which sectors invest the most in R&D? Figures 5, 6 and 7 illustrate R&D expenditure broken down by source of funds.
5 This refers to total gross intramural expenditure on R&D during a given period, financed by different sectors of the economy (business enterprise, government, higher education or private non-profit organizations) or from abroad (rest of the world), and expressed as a percentage. Figure 5. Funding in the Americas GERD by source of funds, 2018 or latest year available Notes: +1 = 2019, -1 = 2017, -2 = 2016, -3 = 2015, -4 = 2014, -9 = 2009. Source: UNESCO Institute for Statistics, June 2020. 5 UIS Fact Sheet No. 59 | June 2020 Figure 6. Funding in Europe GERD by source of funds, 2018 or latest year available Notes: +1 = 2019, -1 = 2017, -2 = 2016, -10 = 2008.
6 Source: UNESCO Institute for Statistics, June 2020. 6 UIS Fact Sheet No. 59 | June 2020 Figure 7. Funding in Africa, Asia and the Pacific GERD by source of funds, 2018 or latest year available Notes: -1 = 2017, -2 = 2016, -3 = 2015, -4 = 2014, -7 = 2011, -8 = 2010, -9 = 2009, -10 = 2008, -11 = 2007, -13 = 2005, -16 = 2002. Source: UNESCO Institute for Statistics, June 2020. Which sectors receive the most investment? Figures 8, 9 and 10 depict R&D expenditure by sector of performance. This refers to total gross intramural expenditure on R&D during a given period by institutions corresponding to each sector (business enterprise, government, higher education and private non-profit organizations), independent of the source of funds and expressed as a percentage.
7 7 UIS Fact Sheet No. 59 | June 2020 Figure 8. A breakdown of R&D investment in the Americas GERD by sector of performance, 2018 or latest year available Notes: +1 = 2019, -1 = 2017, -3 = 2015, -4 = 2014, -16 = 2002. Source: UNESCO Institute for Statistics, June 2020. 8 UIS Fact Sheet No. 59 | June 2020 Figure 9. A breakdown of R&D investment in Europe GERD by sector of performance, 2018 or latest year available Notes: -1 = 2017, -10 = 2008. Source: UNESCO Institute for Statistics, June 2020. 9 UIS Fact Sheet No. 59 | June 2020 Figure 10. A breakdown of R&D investment in Africa, Asia and the Pacific GERD by sector of performance, 2018 or latest year available Notes: -1 = 2017, -2 = 2016, -3 = 2015, -4 = 2014, -5 = 2013, -7 = 2011, -8 = 2010, -10 = 2008, -11 = 2007, -13 = 2005, -14 = 2004, -16 = 2002.
8 Source: UNESCO Institute for Statistics, June 2020. Please consult the UIS website to access the UIS database and subscribe to eAlerts on the Institute s latest publications, data visualisations and data releases. For more information on R&D data, please consult the UNESCO eAtlas of Research and Experimental Development at The regional totals/averages presented in this fact sheet are based on UIS regions. Please consult the UIS Data Centre ( ) for other groupings.