Transcription of Global Methane Budget 2016 - GCP : Global Carbon Project
1 Global MethaneBudgetPublished on 12 December 20162016 PDF version (released 12 December 2016 )The Global Methane Budget for 2000-2012 AcknowledgementsThe work presented here has been possible thanks to the enormous observational and modeling efforts of the institutions and networks belowFull references provided in Saunoiset al. 2016 , ESSDA tmospheric CH4datasets NOAA/ESRL (Dlugokenckyet al., 2011) AGAGE (Rigby et al., 2008) CSIRO (Franceyet al., 1999) UCI (Simpson et al., 2012) Top-down atmospheric inversions TM5-4 DVAR (Bergamaschiet al., 2009) LMDZ-MIOP (Pisonet al., 2013) CarbonTracker-CH4 (Bruhwileret al., 2014) TM5-4 DVAR (Houwelinget al., 2014) LMDZt-SACS (Locatelliet al., 2015) NIESTM (Saeki et al.)
2 , 2013; Kim et al., 2011) ACTM (Patraet al., 2016 ) GELCA (Ishizawa et al., 2016 ; Zhuralevet al., 2013)Bottom-up modeling Description of models contributing to the Atmospheric Chemistry and Climate Model IntercomparisonProject (ACCMIP, Lamarqueet al., 2013; Voulgarakiset al., 2013; Naiket al., 2013) Bottom-up studies data and modeling CLM (Riley et al., 2011; Xuet al., 2016 ) CTEM (Melton and Arora, 2016 ) DLEM (Tianet al., 2010;2015) JULES (Hayman et al., 2014) LPJ-MPI (Kleinenet a., 2012) LPJ-wsl(Hodsonet al, 2011) LPX-Bern (Spahniet al., 2011) ORCHIDEE (Ringevalet al., 2011) SDGVM (Woodward and Lomas, 2004) TRIPLEX-GHG (Zhu et al., 2104; 2015) VISIT (Ito ad Inatomi, 2012) GFEDv3 (Van der Werfet al.
3 , 2010) GFEDv4s (Giglioet al., 2013) (Kaiser et al., 2012) FINNv1 (Wiedinmyeret al., 2011) IIASA (H glund-Isaksonn, 2012; Klimontet al., 2016 ) EPA, 2011; 2012 2010 and FT2012 ( , 2013; 2014) FAO (Tubielloet al., 2013)Contributors:81people| 53organisations| 15countriesScientificcontributors:Mariel leSaunoisFrance|PhilippeBousquetFrance|B enPoulterUSA|AnnaPeregonFrance|PhilippeC iaisFrance| | |GiuseppeEtiopeItaly|DavidBastvikenSwede n|SanderHouwelingTheNetherlands|GreetJan ssens-MaenhoutItaly| |SimonaCastaldiItaly| |MihaiAlexeItaly| | |PeterBergamaschiItaly| |GordonBrailsfordNewZealand|VictorBrovki nGermany|LoriBruhwilerUSA|KristoferCovey USA|CyrilCrevoisierFrance|PatrickCrillSw eden|KristoferCoveyUSA|CharlesCurryCanad a|ChristianFrankenbergUSA|NicolaGedneyUK |LenaH glund-IsakssonAustria|MisaIshizawaJapan| AkihikoItoJapan|FortunatJoosSwitzerland| Heon-SookKimJapan|ThomasKleinenGermany|P aulKrummelAustralia|Jean-Fran
4 OisLamarqueUSA|RayLangenfeldsAustralia|R obinLocatelliFrance|ToshinobuMachidaJapa n|ShamilMaksyutovJapan| |JuliaMarshallGermany| |IsamuMorinoJapan|VaishalaNaikUSA|SimonO DohertyUK| | |ChanghuiPengCanada|ShushiPengChina| |IsabellePisonFrance|CatherinePrigentFra nce|RonaldPrinnUSA|MichelRamonetFrance| |MakotoSaitoJapan|MoniaSantiniItaly|Ronn ySchroederUSA| |RenatoSpahniSwitzerland|PaulSteeleAustr alia|AtsushiTakizawaJapan| |HanqinTianUSA|YasunoriTohjimaJapan|Nico lasViovyFrance|ApostolosVoulgarakisUK|Mi chielvanWeeleTheNetherlands|GuidovanderW erfTheNetherlands|RayWeissUSA|ChristineW iedinmyerUSA| |AndyWiltshireUK|DougWorthyCanada| |XiyanXuUSA|YukioYoshidaJapan|BowenZhang USA|ZhenZhangUSA|QiuanZhuChinaDatavisual isationsupportatLSCE:PatrickBrockmannFra nce|CathyNanginiFranceContact: accessGlobal Methane Budget Website ContactsEmailPhilippe data are shown interagramsCH4(TgCH4) for emissions and sinksparts per billion (ppb) for atmospheric concentrations1 teragram(Tg) = 1 million tonnes = 1 Tg CH4 per ppbDisclaimerThe Global Methane Budget and the information presented here are intended for those interested in learning about the Carbon cycle, and how human activities are changing it.
5 The information contained herein is provided as a public service, with the understanding that the Global Carbon Project team make no warranties, either expressed or implied, concerning the accuracy, completeness, reliability, or suitability of the MethodsThe Methane context After Carbon dioxide (CO2), Methane (CH4) is the second most important greenhouse gas contributing to human-induced climate change. For a time horizon of 100 years, CH4has a Global Warming Potential 28 times larger than CO2. Methane is responsible for 20% of the Global warming produced by all greenhouse gases so far. The concentration of CH4in the atmosphere is 150% above pre-industrial levels (cf. 1750). The atmospheric life time of CH4 is 9 2 years, making it a good target for climate change mitigation Methane also contributes to tropospheric production of ozone, a pollutant that harms human health and ecosystems.
6 Methane also leads to production of water vapor in the stratosphere by chemical reactions, enhancing Global to 2012 Sources : Saunoiset al. 2016 , ESDD; Kirschkeet al. 2013, NatureGeo.; IPCC 2013 5AR; Voulgarakiset al., 2013 Top-down budgetGround-based data from observation networks (AGAGE, CSIRO, NOAA, UCI, LSCE, others).Satellite data (SCIAMACHY, GOSAT)Agriculture and waste related emissions, fossil fuel emissions ( , USEPA, GAINS, FAO).Fire emissions (GFED3 & 4s, FINN, GFAS, FAO).Biofuel estimatesEnsemble of 11 wetland models, following the WETCHIMP intercomparisonModel for Termites emissionsOther sources from literatureSuite of eight atmospheric inversion models (TM5-4 DVAR (JRC & SRON), LMDZ-MIOP, PYVAR-LMDz, C-Tracker-CH4, GELCA, ACTM, TM3, NIESTM).
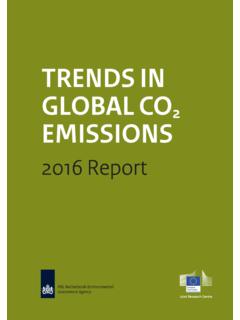
7 Ensemble of 30 inversions (diff. obs& setup) From Kirschkeet al., (2013) Long-term trends and decadal variability of the OH CTMs uptake & chlorine sink taken from the literatureAn ensemble of tools and data to estimate the Global Methane budgetAtmospheric observationsMethane sinksInverse models Biogeochemistry models & data-driven methodsEmission inventoriesBottom-up budgetCH4 Atmospheric Growth Rate, 1983-2012 Source:Saunoiset al. 2016 , ESSD (Fig. 1) Slowdownof atmosphericgrowthrate before2006 Resumedincreaseafter2006CH4 (ppb) GATM (ppb yr-1) 2000-2006: ppb/yr2007-2012: ppb/yrAtmospheric observations200520082011201420172020 1750180018501900CH4 concentrations (ppb)RCP 6 RCP emissions (Tg )RCP 6 RCP 370380390400410420CO2 concentrations (ppm)200520082011201420172020 Years789101112CO2 emissions (Gt )EDGARv42FT2012 CDIAC Boden et al.
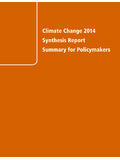
8 , 2015 Atmospheric concentrations (top plot): Methane concentrations rose even faster in 2014 and 2015, more than 10 ppb/yr. The recent atmospheric increase is approaching the scenarioAnthropogenic emissions (bottom plot): infers an increase in emissions that is roughly twice as fast as EPA and GAINS-ECLIPSE5a before 2010 Bottom-up inventories are higher than any RCPs scenarios, except Anthropogenic Methane Emissions & RCPsAtmospheric observationsEmission inventoriesSource: based on Saunoiset al. 2016 , ERL; Meinshausenet al., 2011 Observed Concentrations Compared to IPCC ProjectionsDecadalemissions& sinksGlobal Methane Budget 2003-2012 : Saunoiset al. 2016 , ESSD (Fig 3); Biogeochemistry models & data-driven methodsMapping of the largest Methane source categoriesEmission inventoriesSource: Saunoiset al.
9 2016 , ESSD; Poulteret al, ERL in reviewBiogeochemistry models & data-driven methods WetlandsarethelargestnaturalglobalCH4sou rce Emissionfromanensemblecarbon-cyclemodels constrainedwithremotesensingsurfacewater andinventory-basedwetlandareadata. Theresultingglobalfluxrangefornaturalwet landemissionsis153 227 TgCH4/yrforthedecadeof2003 2012,withanaverageof185 TgCH4 Methane emissionsSource: Saunoiset al. 2016 (Fig 4); Etiope(2015), Kirschkeet al., 2013)Biogeochemistry models & data-driven methodsMapping other natural sourcesTermites mg(CH4). (a) (b) (a)Geological reservoirsbased on a data-driven method Termitesbased on a process-based model Othernaturalsourcesnotmappedherearefresh wateremissions,permafrostandhydratesTrop ospheric OH450-620 Tg/yrStratospheric chemistry15-85 Tg/yrTropospheric chlorine15-40 Tg/yrSoil uptake10-45 Tg/yrMethane Sinks (2000s)Source : Kirschkeet al.
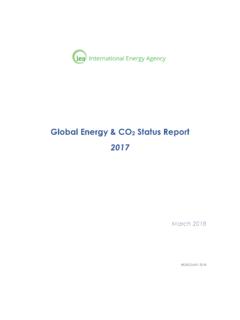
10 2013 Methane sinksFreshwaters122 [100%]Wild animals10 [100%]Wild fires3 [100%]Termites9 [120%]Geological40 [50%]Oceans3 [100%]Permafrost1 [100%] Global methaneemissions2003-2012 Natural wetlands Othernaturalemissions Biomass/biofuelburning Fossilfuel use Agriculture & waste 167 [80%]185 [40%]Top-down budgetAtmosphericinversions559 TgCH4/yr[540-568]Bottom-up budgetProcessmodels, inventories, data drivenmethods734 TgCH4/yr[596-884]Mean[min-maxrange %]64 [150%]199 [90%]34 [55%]30 [30%]105 [50%]121 [20%]188 [65%]195 [15%]Coal42 [80%]Gas& oil79 [10%]Rice 30 [10%]Entericferm& manure106 [20%]Landfills& waste59 [20%]Source: Saunoiset al. 2016 , ESSDTop-down budgetBottom-up budgetBottom-up budgetTop-down Budget (TgCH4/yr)Mean[uncertainty=min-max range %]Mean[uncertainty=min-maxrange %] Globalemissions:559 TgCH4/yr[540-568]forTD734 TgCH4/yr[596-884]forBU TDandBUestimatesgenerallyagreeforwetland andagriculturalemissions EstimatedfossilfuelemissionsarelowerforT DthanforBUapproaches LargediscrepancybetweenTDandBUestimatesf orfreshwatersandnaturalgeologicalsources ( othernaturalsources ) Global MethaneEmissions 2003-2012 Source: Saunoiset al.