Transcription of Global nitrogen fertiliser demand and supply: trend ...
1 Global nitrogen fertiliser demand and supply: trend , current level and outlook Patrick Heffer1 and Michel Prud'homme1. 1 International Fertilizer Association (IFA), Paris 75116, France, , Abstract In the perspective of a world reaching more than 9 billion people by 2050, and the need to alleviate persistent hunger, which still affects more than 800 million people, nutrient management shall ensure continuous increase of agricultural production. The latest projections by the Food and Agriculture Organization of the United Nations (FAO) show that feeding that many people would require raising overall food production by some 60% between 2005/07 and 2050 (FAO, 2012) in the absence of changes to current biofuel mandates. This shall be done while mitigating environmental impacts of farming in general, and improving plant nutrient management in particular. Agricultural intensification using fertilizer best management practices is a desirable and necessary goal. The alternative agricultural extensification means increased conversion of natural habitats to farmland, biodiversity loss, and a significant increase in Global greenhouse gas emissions.
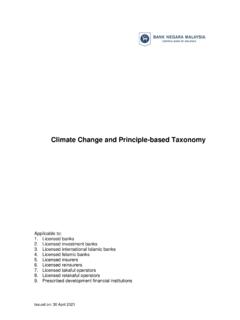
2 The need to improve food security strongly influenced world fertilizer demand over the past decades. Future demand is likely to be driven by a broader set of considerations, including the need to reduce environmental impacts from nutrient losses. The paper analyzes Global nitrogen (N) fertilizer demand and supply trends and outlook under this changing operating environment. nitrogen Fertilizer Use Evolution of Global Fertilizer Consumption between 2000/01 and 2013/14. World fertilizer consumption increased steadily between 2000/01 and 2007/08, by 23%, rising from to teragrams (Tg) of nutrients (N+P2O5+K2O). During the same period, Global N fertilizer consumption rose by 23%, from to Tg N. In 2008/09, world consumption contracted by 8%, to Tg nutrients, due to the economic downturn and financial crisis. nitrogen consumption was much less impacted (-2%) than that of phosphate (P) and potassium (K), which fell by 12% and 20%, respectively. Global demand started to rebound in 2009/10, to reach Tg nutrients by 2013/14, a 17% increase over this five-year period (Figure 1).
3 Reflecting the smaller drop in 2008/09, N fertilizer consumption grew more modestly (+12%) during that period, to Tg N. Between 2000/01 and 2013/14, aggregate world fertilizer consumption rose by 33%. Potash consumption recorded the strongest growth (+39% to Tg K2O), followed by N (+35%, to Tg N) and P (+26%, to Tg P2O5), reflecting progressive rebalancing of the N:K ratio. Figure 1: Evolution of Global fertilizer consumption by nutrient (Tg N+P2O5+K2O) (IFA, 2016a). Proceedings of the 2016 International nitrogen Initiative Conference, "Solutions to improve nitrogen use efficiency for the world", 4 8 1. December 2016, Melbourne, Australia. Between 2000/01 and 2013/14, 83% of the increase in world fertilizer consumption came from developing countries. East Asia and South Asia were the two key drivers, accounting together for 70% of the Global expansion . During that 13-year period, N fertilizer consumption rose by Tg N in East Asia (+44%) and by Tg N in South Asia (+48%).
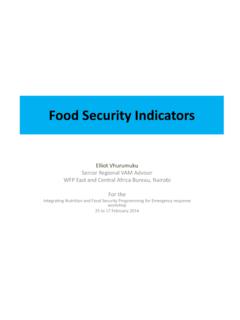
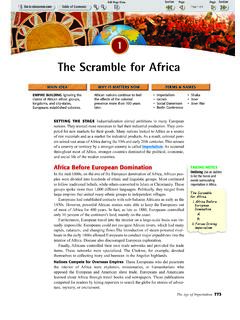
4 Volume increases were much more modest in the rest of the world. In relative terms, the strongest expansion was observed in Eastern Europe & Central Asia (+84%) reflecting a progressive rebound of the regional market following the collapse of the Former Soviet Union. Western &. Central Europe is the only region that witnessed a market contraction (-2%) during that period owing to significant improvements in N use efficiency and increasing manure-N recycling. In the rest of the world, N. fertilizer consumption evolved more modestly (Figure 2). Figure 2: Evolution of regional N fertilizer consumption by region (Tg N) (IFA, 2016a). Global nitrogen Fertilizer Consumption in 2013/14. Geographical Breakdown of nitrogen Fertilizer Consumption Total world N fertilizer consumption in 2013/14 is estimated at Tg N. Three national markets dominate Global consumption: China, India and the United States with an aggregate market share of 57%. Another five countries, with domestic markets between 2 and 4 Tg N, account for 13% of world consumption: Brazil, Pakistan, Indonesia, Canada and France (Figure 3).
5 Figure 3: Country breakdown of Global N fertilizer consumption in 20134/14 (IFA, 2016a). ROW = rest of the world Proceedings of the 2016 International nitrogen Initiative Conference, "Solutions to improve nitrogen use efficiency for the world", 4 8 2. December 2016, Melbourne, Australia. World nitrogen Fertilizer Consumption by Product The N fertilizer market is largely dominated by urea, which accounted in 2013/14 for 57% of Global N. fertilizer use (Figure 4). In addition, the urea market share is steadily rising, from 49% in 2000/01, reflecting a 54% increase of urea consumption over that period. Ammonium phosphates are the second fastest expanding N market: 8% of world N fertilizer consumption in 2013/14 and an 80% growth between 2000/01. and 2013/14. Figure 4: Breakdown by product of Global N fertilizer demand in 2013/14 (IFA, 2016a). Global and Regional nitrogen Fertilizer Use by Crop The latest estimates of fertilizer use by crop relate to the 2010/11 campaign (Heffer, 2013).
6 Total N fertilizer applications to cereals in that campaign amounted to Tg N, about 55% of world N fertilizer utilization. The three main cereals, wheat, rice and maize, accounted each for 15% to 18% of the world total, while fertilizer use on the other cereals represented of the total. Oil crops accounted together for of world fertilizer consumption ( Tg N), with market shares of for soybean, for oil palm , and for the other oilseeds. Fibre crops (mostly cotton), sugar crops (mostly sugar cane) and roots and tubers (mostly potatoes) received , and , respectively, of Global N fertilizer applications. Fruits and vegetables together accounted for almost 15% of world N fertilizer uses. The other crops received the remaining 12%. Cereals accounted for a larger share of world N fertilizer consumption (55%) vs. P and K fertilizer uses (49%. and 37%, respectively). In contrast, because of the impact of soybean, oilseeds had a much higher contribution to P (15%) and K (20%) consumption vs.
7 N uses (7%). The relative contribution of the different crop categories to total N fertilizer consumption varies widely between countries as illustrated in Figure 5. In some countries, one or two crop categories largely influence the market. For instance, maize accounts for almost half of the United States' N fertilizer consumption; in China, fruits and vegetables together receive at least 30% of domestic N fertilizer applications; in Bangladesh, the rice share of N fertilizer uses is above 80%. Proceedings of the 2016 International nitrogen Initiative Conference, "Solutions to improve nitrogen use efficiency for the world", 4 8 3. December 2016, Melbourne, Australia. Figure 5: Relative contribution of the main crop categories to total N fertilizer consumption in 2010/11 in the main fertilizer markets (Heffer, 2013). nitrogen Fertilizer Use Efficiency: An Important Key Driver of Future demand Nutrient use efficiency is an indicator of nutrient management performance, which reflects the efficiency of uptake by crops of the nutrient input to a crop production system.
8 Norton et al. (2015) recommend using the output/input ratio to monitor N use efficiency (NUE). This indicator is derived from the sum of the N content in all harvested products and the sum of all N inputs (fertilizers, manure, biological N fixation, etc.) within the boundary of the system considered. nitrogen use efficiency levels and trends vary widely between regions and countries (Norton et al., 2015;. Fixen et al., 2014) because of the diversity of soils, crops, climate, farmers' access to technology and knowledge, and policy priorities. However, NUE tends to follow a typical trend in relation to yield over time (Figure 6), with different countries being at different points on the curve. When N application rates are low, crop yield is usually low but NUE levels can be well above 100%, illustrating soil N mining. As fertilizer application rates increase, yield rises while NUE contracts up to a certain point. Beyond that point, NUE and yield increase in synchrony, reflecting adoption of fertilizer best management practices and, more generally, sustainable intensification (producing more with less).
9 NUE levels can only increase up to a hypothetical limit, below 100%, due to unavoidable N losses associated with biological activity in soils. When approaching the NUE limit, future yield gains would have to come once again from higher N inputs from different sources as there would be little or no potential to further improve NUE. At the regional level, the following trends are observed (IFA, 2014a; Fixen et al., 2014; Figure 6): In developed countries, NUE has undergone steady improvement over the past three decades, driven by the adoption of fertilizer best management practices. Similar trends are observed for N fertilizer applied to maize in the United States, wheat in West Europe or rice in Japan. In China, N fertilizer consumption has been increasing faster than cereal yield gains, triggering a steady decline of NUE in cereal systems. High application rates to fruits and vegetables also contributed to NUE contraction. A reversal of trend ( an improvement) is observed for 5-10 years, reflecting the government's new focus on resource efficiency.
10 In India, N fertilizer applications to cereals are still increasing faster than cereal yields, driven by a fertilizer subsidy regime that has contributed to unbalanced and inefficient fertilizer use. Hence, NUE. is still declining, but a rebound can be anticipated if the fertilizer subsidy policy is revised, reducing the differential treatment between urea and the other fertilizer products. In Sub-Saharan Africa (SSA), farmers use 10-15 kg of nutrients per hectare, about one tenth of the world average. In most countries, NUE levels are well above 100%, causing widespread soil nutrient depletion, land degradation and low agricultural productivity. With fertilizer consumption rising firmly for 5-10 years in some SSA countries, NUE is expected to progressively improve ( decline below 100%), but SSA would still remain in the top left of the curve. Proceedings of the 2016 International nitrogen Initiative Conference, "Solutions to improve nitrogen use efficiency for the world", 4 8 4.