Transcription of Global Port Trends 2030 - Deloitte
1 Global Port Trends 2030 The future port landscape Deloitte Global Port Advisory, April 2020 2020 Deloitte The Netherlands2 Global Port Trends 2030 Disclaimer:Thefindingsandassumptionsinth isdocumentarepartlybasedon whatif 2020 Deloitte The Netherlands3 Global Port Trends 2030 Executive summaryGlobaltrends2030 aimistodeliversupportandinsighttothemari timeindustry ,demographical,technological, ,portoperator, ,thecompetitivepositionofstakeholders,ec osystems, ,itisimportantfortheindustry ,weoptedforamoreexhaustiveoverviewofdriv ers, driversPort Trends to 2030 The port industry in 2030 Global Port Trends 2030 2020 Deloitte The Netherlands5 Note on ,governmentsandbusinesses , , , , , ,tiltinAsia.
2 S(andpossiblyothercountries ) (digital) , (containerandautomotive) ,goodhealthandsafety,TheDeloittePortsAdv isoryteam 2020 Deloitte The Netherlands6 Global Port Trends 2030 IntroductionGlobal Port Trends 2030 2020 Deloitte The Netherlands7 IntroductionSustainability driversTechnological driversDemographic driversThe port industry in 2030 New trade routesIncreased focus sustainabilitySpatial strategiesProtectionismTilt in AsiaIncreased use of technologyDistinguishing strategyStrategic infrastructure investmentsNew production chainsNiche marketsIncreased collaboration12345678 ABCThe port of today is not the port of tomorrow.
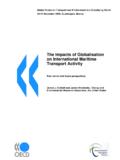
3 Induced by demographic, technological, and sustainability drivers, it is expectedthat the maritime sector will be affected by several important Trends . We have identified eight individual Trends , and three followingbroader Trends , that will jointly influence the outlook of the port industry in 2030. This report will discuss how the most important maritime Trends follow from the different drivers, and what this may mean for the port industry in the future. 2020 Deloitte The Netherlands8 Global Port Trends 2030 Demographic driversGlobal Port Trends 2030 2020 Deloitte The Netherlands9 Looking forward, Global demographic Trends indicate a rising population, although the growth rate is expected to declineDemographic drivers | Population growth1401062124819701950199020102030205 0 Forecast0,2197019501,61990203020100,0205 00,40,60,81,01,21,41,8 ForecastPopulation growth%BillionTotal populationSource.
4 Worldbank based on UN data 2015 Global Port Trends 2030 2020 Deloitte The Netherlands10 Population is expected to decrease in China and large parts of Europe, the population in Africa is expected to increase significantlyDemographic drivers | Population growthDecreasing >5%Decreasing <5%Increasing 0-10%Increasing 10-20%Increasing 20-40%Increasing >40%No dataSource: Worldbankbased on UN data 2015 Expected population growth till 2050 Global Port Trends 2030 2020 Deloitte The Netherlands11203520159019801960101950402 0101970702000202020302040199050020306080 100195520251965197519851995200520452050 Our urban centers will keep growing, resulting in an increased pressure on the, already scarce, spaceDemographic drivers | UrbanizationForecastChinaNorth AmericaEuropeWorldOceaniaSouth AmericaSource.
5 Worldbank based on UN data (2015), UN The World s Cities (2018)% of urbanisationGlobal Port Trends 2030 2020 Deloitte The Netherlands12 The shift in the economic balance and increased inequalities are expected to increase future politic tensions and protectionismDemographic drivers | Politics2040301980202010200007020405060 Top 1%Top 40%%ForecastGlobal wealth inequality (assuming no changes)27%25%25%30%24%23%23%25%23%9%6%6 %9%17%19%0%100%20243%4%201020204%Sources : IMF(2019), WID World (2017)RestChinaEUIndiaJapanUSContributio n to world GDP 2020 Deloitte The Netherlands13 Global Port Trends 2030 Technological driversGlobal Port Trends 2030 2020 Deloitte The Netherlands14 Ports are increasingly implementing innovations in the entire value chain with a wide range of used technologiesTechnological drivers | Increase in innovationsSeaside Port Landside ProducerTransport nodeMaritime transportApproach servicesLoading/ unloadingStorageIndustrial processingIntermodal transportDry portHinterland transportVirtual RealityCommodity data
6 AnalyticsIntelligent Asset DevelopmentIoT enabled remote operationsBig data AnalyticsBig data AnalyticsCross functional and geographical working Drones/RoVsDrones/RoVsSmart CitiesSmart gridsSafety AnalyticsInternet of ThingsDrones/RoVsMachine to machine communicationPlatform solutionsSmart energy managementAutonomous transportSmart meteringSupplyanalyticsDemand analytics3D PrintingRFID for logistics and transportationRFID for logistics and transportationIntelligent risk and complianceIntelligent risk and complianceRoboticsRoboticsRoboticsOutsou rcingOutsourcingPredictive maintenance Predictivemaintenance Autonomous transportAutonomous transportCollaborationtoolsCollaboration toolsSupply chain and vendor optimizationSupply chain and vendor optimizationSingle view of stockSingle view of stockReal-time digital resource managementPricing analyticsRoboticsIntelligent Asset DevelopmentMobile WorkforceNote: Non exhaustiveSource.
7 Monitor Deloitte Deloitte Port AdvisoryGlobal Port Trends 2030 2020 Deloitte The is expected that technological implementation in the maritime sector will keep increasing thanks to increased market investments and decreasing costTechnological drivers | Decrease cost of technologyThe declining cost of advanced +20%Device hardwareNetwork connectivityPlatforms/applications/cloud solutionsSystems integrationSources: Deloitte analysis, Accenture (2017)Forecasted Global IoT market spending ($ billion)Cloud storage costs ($US/GB per month)EV battery pack ($US/kWh) Global bandwidth costs ($US/1000 MBps)3d printing machines ($US/machine)
8 2002=100 2020 Deloitte The Netherlands16 Global Port Trends 2030 Environmental driversGlobal Port Trends 2030 2020 Deloitte The Netherlands17 Temperature increase by 2100 The average Global temperature is expected to keep increasing due to greenhouse gas emissionsEnvironmental drivers | Global temperatureGHG emissions projection (2010-2100)Source: OECD (2012), OECD Environmental Outlook to 2050201020202030204020502060207020802090 21000601203 6 Celsius2 CelsiusParis climate agreement targetOutlook BaselineGtCO2eGlobal Port Trends 2030 2020 Deloitte The Netherlands18 Efforts to reduce the carbon footprint and improve the environmental performance of the maritime sector remain high on the international agendaEnvironmental drivers | RegulationThe new IMO 2020 regulation requires to bring the Sulphur cap in fuel oil for ships down from per cent to per commercial seagoing vessels flying with an EU
9 Member State as flag state may be recycledonly in designated ship recycling facilities included in the European List of ship recycling initial IMO strategy aims to reduce CO2 emissions from international shipping by at least 40% by 2030, pursuing efforts towards 70% by 2050, and to reduce GHGby at least 50% by 2050 compared to requires vessels to install ballast water treatment systems no later than the first renewal of the International Oil Pollution Prevention (IOPP) certificate. The IMO energy efficiency design (EEDI) index sets standards for new ships and associated operational energy efficiency measures for existing ships.
10 Important recent regulatory developmentsSDG 14aims to sustainably manage and protect marine and coastal ecosystems from pollution, as well as address the impacts of ocean Global transition to a cleaner and greener maritime sector is underway. Increased international maritime environmental regulations for Sulphur emissions, greenhouse gas emissions, and marine organisms and ship recycling will affect the Port Trends 2030 2020 Deloitte The Netherlands19 Societal pressure on environmental performance is expected to increase furtherEnvironmental drivers | RegulationVoices to respond to climate change are amplifying throughout the world, asking political leaders and businesses to do more about climate maritime Sector has not been included in the Paris Agreements, nonetheless.