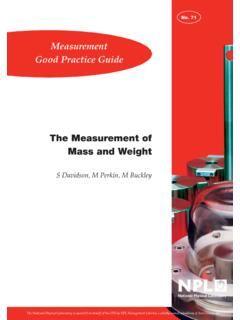
Transcription of GOOD PRACTICE GUIDE FlOw MEAsUREMEnT …
1 good PRACTICE GUIDEFlOw MEAsUREMEnT uncertainty AnD data Foreword 21. MEAsUREMEnT uncertainty 3 Expressing uncertainty 3 Error versus uncertainty 4 uncertainty terminology 5 Evaluating uncertainty 6 Common sources of uncertainty 7 Reference sources 72 Calculation Methods 8 Introduction 8 Type A analysis 8 Arithmetic mean 8 Spread or standard deviation 9 Normal or Gaussian distribution 10 Type B analysis 11 Rectangular and normal distribution 11 Skewed distributions 123 Combining Uncertainties 13 Expressing a measured uncertainty 13 in terms of the required output Analytical method 13 Numerical method 14 Confidence levels 15 Root sum squared (quadrature) combination 16 Correlation 17 Handling correlation 17 Sources of correlation 184 The Standard (GUM) Method of 18 uncertainty Calculation Identifying uncertainty sources 18 and estimating their magnitude Budget Table: stage 1 19 Standard uncertainties 19 Combining the uncertainties 19 Explanation of combination 21 methods in the table The importance of uncertainty 21 in measurement5 Recommended Further Reading 216 data reconciliation 22 Introduction to data reconciliation 22 Practical application 22 Calculation Procedure 23 Numerical example 23 System specification 23 Nodal balances 24 data reconcilitation 25 Quality (or accuracy) indices 26 The importance of data reconciliation 277 Recommended Further Reading 27 The aim of this document is to provide an intermediate level good PRACTICE GUIDE with regard to the subjects of uncertainty analysis and data reconciliation .
2 uncertainty AnalysisSince no MEAsUREMEnT is ever exact, to fully express the result of a MEAsUREMEnT , one must also express the margin of doubt. This degree of doubt is known as the uncertainty . Knowledge of the uncertainty in a MEAsUREMEnT can potentially save companies substantial amounts of revenue. data ReconciliationData reconciliation is a statistical technique based on MEAsUREMEnT uncertainty . It has been applied across a variety of industrial sectors to assist in the identification of instrumentation PRACTICE Guide1 ForewordMeasurement UncertaintyIt is a popular misconception that MEAsUREMEnT is an exact science. In fact all measurements are merely estimates of the true value being measured and the true value can never be known. An estimate implies that there is some degree of doubt about the accuracy of that MEAsUREMEnT . For example, the repeated MEAsUREMEnT of a fixed quantity will never yield the same result every time.
3 The degree of doubt about the MEAsUREMEnT becomes increasingly important with the requirement for increased accuracy. For example, because of the relative cost of the fluids, MEAsUREMEnT of the flow of petroleum must be much more accurate than say the MEAsUREMEnT of water flow for either industrial or domestic supply. uncertainty of MEAsUREMEnT gives an indication of the quality or reliability of a MEAsUREMEnT result. data ReconciliationOver the last few years UK industry has come under pressure from regulatory bodies to increase the accuracy and reliability of their flow metering. This has necessitated investment in new plant, data control systems and general data acquisition infrastructure. A cost-effective way of increasing confidence in data is to use a technique known as data reconciliation . This method, effectively a system self-verification can quickly identify instruments that may be operating outside their uncertainty bands or that may have malfunctioned in some way.
4 This GUIDE is aimed at people who already have some knowledge of uncertainty and wish to learn about the numerical techniques involved and also wish to understand the application of data reconciliation to flow MEAsUREMEnT uncertainty and data Reconciliation21 MEAsUREMEnT UncertaintyWhen we make a MEAsUREMEnT of a quantity the result that we obtain is not the actual true value of the quantity, but only an estimate of the value. This is because no instrument is perfect; there will always be a margin of doubt about the result of any MEAsUREMEnT . Expressing uncertaintyThe uncertainty of a MEAsUREMEnT is the size of this margin of doubt; in effect it is an evaluation of the quality of the MEAsUREMEnT . To fully express the result of a MEAsUREMEnT three numbers are required:(1) The measured value. This is simply the figure indicated on the measuring instrument.
5 (2) The uncertainty of the MEAsUREMEnT . This is the margin or interval around the indicated value inside which you would expect the true value to lie with a given confidence level.(3) The level of confidence attached to the uncertainty . This is a measure of the likelihood that the true value of a MEAsUREMEnT lies in the defined uncertainty interval. In industry the confidence level is usually set at 95%. Example 1: Expressing the answerSuppose we are taking a reading of a flow rate of oil in a pipeline. The measured value from the flow meter is m3/hr. We have determined, by analysing the MEAsUREMEnT system that the uncertainty at 95% confidence is 3%. How do we express this result fully, including the uncertainty ?Figure 1: An illustration of MEAsUREMEnT uncertaintyThis result of this MEAsUREMEnT should be expressed as:That is we are 95% confident that the true value of this MEAsUREMEnT lies between and m3/hr.
6 good PRACTICE +- at 95% Error versus uncertaintyVery often people confuse error and uncertainty by using the terms interchangeably. As discussed in Section , uncertainty is the margin of doubt associated with a MEAsUREMEnT . Error is the difference between the measured value and the true value. Figure 2: An illustration of MEAsUREMEnT errorMeasurements should be fit for purpose. For example, if we are fitting curtains in a window our MEAsUREMEnT of the window space need not be very accurate. However if we are fitting a pane of glass in the same window our MEAsUREMEnT should be more careful and have a lower value of uncertainty . Example 2: The effect of errorsIn financial terms the expression of uncertainty allows us to estimate the degree of exposure caused by a measurementFigure 3: The effect of errorsFor example, if an oil field produces 10,000 barrels per day and the cost of oil is $100 per barrel then if your flow meter over-reads by 1% you will lose $20,000 every day.
7 uncertainty is also a vital part of the calibration process where the uncertainty should be reported on the certificate. Flow MEAsUREMEnT uncertainty and data uncertainty terminologyAccuracyOften with documentation accompanying an instrument the accuracy of the instrument is given in numerical terms. This is incorrect; accuracy is a qualitative rather than a quantitative term. So for example, it is perfectly correct to state that one instrument is more accurate than another but wrong to ascribe a number to the is defined as the closeness of agreement between independent results obtained using the same method on independent test material, under the same conditions ( same operator, same apparatus, same laboratory and after short intervals of time). Accuracy and repeatability are often confused. Results that are accurate are also repeatable but results that are repeatable may not necessarily be can say that: good accuracy means good repeatability Poor repeatability means poor accuracy good repeatability does not necessarily mean good accuracyFigure 4: The relationship between repeatability and accuracy good PRACTICE Evaluating uncertaintyThe process of evaluating the uncertainty of an individual MEAsUREMEnT involves a series of simple and logical steps.
8 1. Define the relationship between all of the inputs to the MEAsUREMEnT and the final result. For example, a MEAsUREMEnT may have uncertainty in the calibration and the resolution of the measuring instrument. 2. Draw up a list of all of the factors that you consider to contribute to the uncertainty of the MEAsUREMEnT . This may mean that you consult with the operator who is taking the MEAsUREMEnT and best knows the system. 3. For each of the sources of uncertainty that you have identified, make an estimate of the magnitude of the uncertainty . 4. For the relationship described in sTEP 1, estimate the effect that each input has on the MEAsUREMEnT result. 5. Combine all of the input uncertainties using the appropriate methodology to obtain the overall uncertainty in the final result. 6. Express the overall uncertainty as an interval about the measured value within which the true value is expected to lie with a given level of steps are also summarised in Figure 5: Summary of standard uncertainty calculation techniqueFlow MEAsUREMEnT uncertainty and data Common sources of uncertaintyThe outcome can be affected by a wide range of factors.
9 These commonly include: 1. The measuring instrument The instrument may be affected by influences such as drift between calibrations, the effect of aging, bias in the instrument, electronic noise and mechanical vibration. 2. The effect of the environment Changes in operating conditions such as temperature, pressure and humidity can increase uncertainty . 3. Operator skill Especially when the instrument is complex, some of the measurements depend on the skill and experience of the operator. Following set procedures properly is also a very important discipline. 4. The process of taking the MEAsUREMEnT This can sometimes present problems. It may be that an operator has to read an analogue display with a needle that is fluctuating between two limits on the dial of an instrument. 5. Variation in the measured quantity Often when we are measuring a quantity its value Reference sourcesA more comprehensive account of the methods used in this document is given in the following; ISO/IEC GUIDE 98 (1995).
10 GUIDE to the expression of uncertainty in MEAsUREMEnT (GUM) ISO 5168:2005. MEAsUREMEnT of fluid flow Procedures for the evaluation of 5168 is aimed at the flow MEAsUREMEnT community and contains information and examples in that area, however as ISO 5168 states, the GUM is the authoritative document on all aspects of terminology and evaluation of uncertainty and should be referred to in any situation where this International Standard does not provide enough depth or detail . good PRACTICE Guide72 Calculation IntroductionThe GUM specifies two distinct methods of uncertainty analysis; classified as Type A and Type B analyses. Type A is based upon the statistical analysis of multiple readings of the same MEAsUREMEnT whereas Type B is essentially a non-statistical approach. In most analyses we usually have to apply a mixture of both types to arrive at a Type A Arithmetic meanWhen you take repeated measurements of a nominally constant quantity you will never get exactly the same results.