Transcription of GOOG Exhibit 99.1 Q4 2017 - Alphabet Inc.
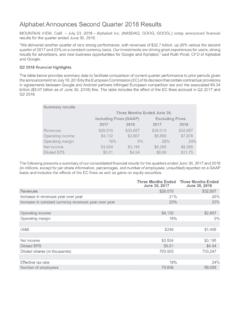
1 Alphabet Announces Fourth Quarter and Fiscal Year 2017 ResultsMOUNTAIN VIEW, Calif. February 1, 2018 Alphabet Inc. (NASDAQ: GOOG, GOOGL) today announced financial results for the quarter and fiscal year ended December 31, 2017 ."Our business is driving great growth, with 2017 revenues of $ billion, up 23% year on year, and fourth quarter revenues of $ billion, up 24% year on year. Our full year operating income growth continues to underscore our core strength, and on top of this, we continue to make substantial investments for the long-term in exciting new businesses," said Ruth Porat, CFO of 2017 financial highlightsIn order to facilitate comparison of current quarter performance to prior periods, this summary table highlights the impact of the Tax Cuts and Jobs Act (Tax Act):Q4 2017 summary results reflecting the impact of the Tax ActIncluding(GAAP).
2 ExcludingRevenues$32,323$32,323 Operating income$7,664$7,664 Provision for income taxes$11,038$1,181 Net (loss) income($3,020)$6,837 Effective tax rate138%15%Diluted EPS($ )$ following summarizes our consolidated financial results for the quarters ended December 31, 2016 and 2017 (in millions, except for per share information, effective tax rate, and number of employees; unaudited), reported on a GAAP basis including the impact of the Tax Act (except for constant currency revenues information):Three Months EndedDecember 31, 2016 Three Months EndedDecember 31, 2017 Revenues$26,064$32,323 Increase in revenues year over year22%24%Increase in constant currency revenues year over year24%24%Operating income$6,639$7,664 Operating margin25%24%Net income (loss)$5,333($3,020)Diluted EPS$ ($ )Diluted shares (in thousands)700,221694,604 Effective tax rate22%138%Number of employees72,05380,110Q4 2017 supplemental informationSegment revenues and operating results (in millions.)
3 Unaudited):Three Months EndedDecember 31, 2016 Three Months EndedDecember 31, 2017 Google properties revenues$17,968$22,237 Google Network Members' properties revenues4,4314,990 Google advertising revenues22,39927,227 Google other revenues3,4034,687 Google segment revenues$25,802$31,914 Other Bets revenues$262$409 Google operating income$7,883$8,763 Other Bets operating loss($1,088)($916)Traffic acquisition costs (TAC) to Google Network Members and distribution partners (in millions; unaudited):Three Months EndedDecember 31, 2016 Three Months EndedDecember 31, 2017 TAC to Google Network Members$3,082$3,674 TAC to Google Network Members as % of Google Network Members' properties revenues70%74%TAC to distribution partners$1,766$2,776 TAC to distribution partners as % of Google properties revenues10%12%Total TAC$4,848$6,450 Total TAC as % of Google advertising revenues22%24%Paid clicks and cost-per-click information (unaudited).
4 Change from Q4 2016 to Q4 2017 (YoY)Change from Q3 2017 to Q4 2017 (QoQ)Aggregate paid clicks43%18%Paid clicks on Google properties48%19%Paid clicks on Google Network Members' properties13%9%Aggregate cost-per-click(14)%(6)%Cost-per-click on Google properties(16)%(7)%Cost-per-click on Google Network Members' properties(4)%1%Impact of the Tax ActThe Tax Act was enacted on December 22, 2017 and resulted in additional tax expense of $ billion in the fourth quarter of 2017 primarily due to the one-time transition tax on accumulated foreign subsidiary earnings and deferred tax announcementsOn January 31, 2018, the Board of Directors (Board) of Alphabet authorized the company to repurchase up to an additional $8,589,869,056 of its Class C capital stock.
5 The repurchase is expected to be executed from time to time, subject to general business and market conditions and other investment opportunities, through open market purchases or privately negotiated transactions, including through Rule 10b5-1 January 31, 2018, the Board appointed John L. Hennessy to serve as Chair of Alphabet s Board. Mr. Hennessy has served as a member of the Board since April 2004 and Lead Independent Director since April and conference call informationA live audio webcast of our fourth quarter 2017 earnings release call will be available at The call begins today at 1:30 PM (PT) / 4:30 PM (ET). This press release, including the reconciliations of certain non-GAAP measures to their nearest comparable GAAP measures, is also available on that also provide announcements regarding our financial performance, including SEC filings, investor events, press and earnings releases, and blogs, on our investor relations website ( ).
6 Forward-looking statementsThis press release may contain forward-looking statements that involve risks and uncertainties. Actual results may differ materially from the results predicted, and reported results should not be considered as an indication of future performance. The potential risks and uncertainties that could cause actual results to differ from the results predicted include, among others, those risks and uncertainties included under the captions Risk Factors and Management s Discussion and Analysis of Financial Condition and Results of Operations in our Annual Report on Form 10-K for the year ended December 31, 2016 and our most recent Quarterly Report on Form 10-Q for the quarter ended September 30, 2017 .
7 Which are on file with the SEC and are available on our investor relations website at and on the SEC website at Additional information will also be set forth in our Annual Report on Form 10-K for the year ended December 31, 2017 . All information provided in this release and in the attachments is as of February 1, 2018. Undue reliance should not be placed on the forward-looking statements in this press release, which are based on information available to the company on the date hereof. We undertake no duty to update this information unless required by non-GAAP financial measuresTo supplement our consolidated financial statements, which are prepared and presented in accordance with GAAP, we use the following non-GAAP financial measures: operating income, excluding the impact of the Q2 2017 European Commission fine (EC fine); provision for income taxes, excluding the impact of the Tax Act; net income, excluding the impact of the Tax Act; effective tax rate, excluding the impact of the Tax Act; diluted earnings per share, excluding the impact of the Tax Act; free cash flow; constant currency revenues; and constant currency revenue growth.
8 The presentation of this financial information is not intended to be considered in isolation or as a substitute for, or superior to, the financial information prepared and presented in accordance with use these non-GAAP financial measures for financial and operational decision-making and as a means to evaluate period-to-period comparisons. We believe that these non-GAAP financial measures provide meaningful supplemental information regarding our performance and liquidity by excluding certain items that may not be indicative of our recurring core business operating results, such as our revenues excluding the impact of foreign exchange rate movements and hedging activities or our financial performance excluding one-time charges that are infrequent in nature.
9 We believe that both management and investors benefit from referring to these non-GAAP financial measures in assessing our performance and when planning, forecasting, and analyzing future periods. These non-GAAP financial measures also facilitate management's internal comparisons to our historical performance and liquidity as well as comparisons to our competitors' operating results. We believe these non-GAAP financial measures are useful to investors both because (1) they allow for greater transparency with respect to key metrics used by management in its financial and operational decision-making and (2) they are used by our institutional investors and the analyst community to help them analyze the health of our are a number of limitations related to the use of non-GAAP financial measures, such as the components of the expenses that we exclude in our calculation of non-GAAP financial measures may differ from our peer companies.
10 We compensate for these limitations by providing specific information regarding the GAAP amounts excluded from these non-GAAP financial measures and evaluating these non-GAAP financial measures together with their relevant financial measures in accordance with more information on these non-GAAP financial measures, please see the tables captioned Reconciliations of non-GAAP financial measures to the nearest comparable GAAP measures, "Reconciliation from net cash provided by operating activities to free cash flow," and "Reconciliation from GAAP revenues to non-GAAP constant currency revenues" included at the end of this relations BALANCE SHEETS(In millions, except share amounts which are reflected in thousands and par value per share amounts)December 31,2016 December 31, 2017 (unaudited)AssetsCurrent assets.