Transcription of Government Of India Ministry of Power Central Electricity ...
1 Power SectorMarch-2017 Government Of IndiaMinistry of PowerCentral Electricity AuthorityNew DelhiSNSection A - Highlights of Power SectorPage1 Electricity Generation for March 2017 (BU)1A & 1B2 Generating Capacity Addition for March 2017 (MW)23 List of Projects Commissioned in March 201734 All India Installed Capacity (MW) Region-wise as on India Installed Capacity (MW) Sector-wise as on Lines Added during March 2017 (Ckms)57 Transformation Capacity Addition during March 2017 (MVA)68 Power Supply Position (Energy & Peak) in March 201779 Peak Shortage of Power Supply (MW) in Different Regions 8-910 All India PLF Sector-wise for March 20171011T & D and AT & C Losses (%)12 All India Village Electrification & Pumpsets Energised as on cost of Power & Average Realisation14 All India per capita consumption of Electricity (KWh)15 All India Coal consumption for Power Generation (MT)1 Capacity Addition Targets and Achievements in 12th Plan122 Capacity Addition Targets & Achievements during March 2017133 Installed Capacity in various Regions including their and Achievements of Transmission Lines in March 2017 2 List of Transmission Lines Commissioned/Ready for commissioning during March 20171 Programme and Achievements of Sub-Stations in March 20172 List of Sub Stations commissioned/ready for commisssioning during March 20171 Electricity Generation (MU) Targets and Achievements for 2016-17 221 Power Supply Position (Provisional) for March 2017232 Peak Demand and Peak Met (Provisional) for March 2017243 Power Supply Position (Revised) for Feb 2017254 Peak Demand and Peak Met (Revised)
2 For Feb 2017265 Notified Power cuts / Restrictions on Industries during March 2017276 Power Supply to Agricultural Sector during March 2017281 Growth of Installed Capacity since 6th Plan292 Growth of Transmission Sector since 6th Plan303 All India Yearly Coal consumption for Power Generation (Utilities)4 All India Annual Per Capita Consumption of Electricity since 20065 Average cost of Power supply & Average realisation (Paisa/kwh)6 Growth of Rural Electrification & Pump Sets Energisation7 Status of Hydro Schemes Cleared by the CEA upto March 20171 Rate of sale of Power for the year 2014-201533-41 Section E - Electricity GenerationSection F - Power supply positionContentsSection G - Growth of Power SectorSection H - Rate of sale of Power for the year 2014-2015 Executive Summary for the Month of Mar 20173211202131 Section B - Capacity Addition Section C - Transmission Lines Section D - Sub StationsSNContentsPageElectricity Generation (Conventional Sources) for March 2017 (BU)1 AElectricity Generation (Conventional & Renewable Sources) for April 2016 to Feb.
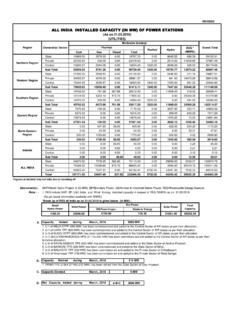
3 2017 (BU)1B2 Generating Capacity Addition for March 2017 (MW)23 List of Projects Commissioned in March 201734 All India Installed Capacity (MW) Region-wise as on India Installed Capacity (MW) Sector-wise as on Lines Added during March 2017 (Ckms)57 Transformation Capacity Addition during March 2017 (MVA)68 Power Supply Position (Energy & Peak) in March 201779 Peak Shortage of Power Supply (MW) in Different Regions 8-910 All India PLF Sector-wise for March 20171011T & D and AT & C Losses (%)12 All India Village Electrification & Pumpsets Energised as on cost of Power & Average Realisation14 All India per capita consumption of Electricity (KWh)15 All India Coal consumption for Power Generation (MT) Section A - Highlights of Power ImportAll India1A1. Electricity Generation for Mar, 2017 (BU) '15 - Mar'16 Apr '16 - Mar ' Change Electricity Generation During April 2015 to Mar 2016 & April 2016 to Mar.
4 2017 (BU) '15 - Mar'16 Apr '16 - Mar '17 Generation from Conventional SourcesGeneration from Renewable SourcesTotal Generation from Conventional SourcesGeneration from Renewable SourcesTotal Growth in Conventional GenerationGrowth in Renewable GenerationGrowth in Total Generation(MU)(MU)(MU)(MU)(MU)(MU)(%)(%) (%)Apr-1699,3455,074104,41986,6954,55391 , ,9036,820106,72395,4025,143100, ,3268,110105,43689,9086,09095, ,6069,545104,15193,1428,872102, ,2379,634104,87195,1227,529102, ,0728,328106,40095,7415,485101, ,7106,287105,99798,6314,354102, ,5695,02098,58985,9064,14190, ,2525,463100,71595,1234,976100, ,6905,806101,49692,1294,37796, ,6305,86298, ,9945, ,061,34175,9491,137,290740,54660,513786, SolarBiomassBagasseSmall HydroOthersTotalSource-Wise All India Generation from Renwables Electricity Generation (Conventional & Renewable Sources)April-Febuary, 2017 vis- -vis April- Febuary, 2016 MonthGeneration (April-Febuary, 2017)Generation (April- Febuary, 2016)% GrowthElectricity Generation From Renewable (source wise)April-Febuary, 2017 vis- -vis April-Febuary, 2016 Feb.
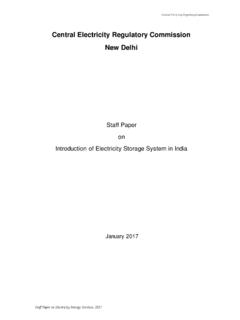
5 , 2017 Apr., 2015 to Feb.,2016 For the Month ofFeb ., Figure in MUCommulative for the , 2016 to Feb., Generating Capacity Addition for Mar, 2017(MW) '15 - Mar '16 Apr '16 - Mar '17% Capacity Addition during April '15 to Mar 16 & April '16 to Mar 17 (MW)% Change 2016 TypeMar-179, , '15 - Mar '16 Apr '16 - Mar '17(i) Thermal(ii)(iii)NuclearHydroRESG rand : Captive Genaration is not included in the total. RES as on TPP U-2 (800) MW was Commisioned on TPS ST-IV U-6 (500) MW was Commissioned TPS ST-II U-4 (195) MW was Commissioned on U-2 1000 (MW) was Commissioned on List of Projects Commissioned During Mar 20174. All India Installed Capacity (MW) Region-wise as on STPP-II U-4 ( 660) MW was Commisioned on TPP U-2 (250) MW was Commisioned on TPP U-2 (800) MW was Commisioned on TPP U-2 (250) MW was Commissioned on = TotalTHERMALN uclearHydroRESRES as on All India Installed Capacity (MW) Sector-wise as on , , 32%Private, , 44% Central , , 24%All India Installed Capacity(MW) as on 31-03-2017 (Sector-Wise)Voltage Level+/- 500 KV HVDC+/- 800 KV HVDC765 KV400 KV220 KVAll IndiaVoltage Level+/- 500 KV HVDC+/- 800 KV HVDC765 KV400 KV220 KVAll India5 Mar-160 Apr '16 - Mar '17017211221290645006.
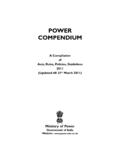
6 Transmission Lines Added during Mar, 2017 (Ckms)78267382717109923935601 Transmission Lines Added during Apr '15 to Mar '16 & Apr '16 to Mar'17 (Ckms)Mar-1744281140 Apr '15 - Mar '166995106576030263001118135062618239327 17050010001500200025003000 Mar-17ckmsMar-16 Mar-172811426300900014000190002400029000 34000ckmsApr '15 - Mar '16 Apr '16 - Mar '17 Voltage Level+/- 800 KV HVDC+/- 500 KV HVDC765 KV400 KV220 KVAll IndiaVoltage Level+/- 800 KV HVDC+/- 500 KV HVDC765 KV400 KV220 KVAll India615004500 All India Transformation Capacity Addition during Apr '15 to Mar '16 & Apr '16 to Mar'17 (MVA)81816026500313401947662849195001704 5248040 Mar-16 Mar-17 April' 15 to Mar '16 April '16 to Mar'17188930600020271672045517. Transformation Capacity Addition During Mar, 2017 (MVA)06000526076330300018893202711800018 50019000195002000020500 MVAT ransformation Capacity Addition during Mar 2017 Mar-16 Mar-1762849818160745201490401 MVAA pril' 15 to Mar '16 April '16 to Mar'17 Mar'16 Mar '17 Mar '16 Feb' '17 Northern 2535726,5862424426, 3063730,5793061830, ,8472752128, 1113810,6981107910, Eastern 11971,21111631, India9614897,9239462597, 16 Mar 17 Mar '16 Mar '17 Mar16 Mar.
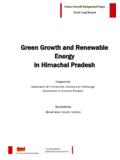
7 '17 Northern Eastern Power Supply Position (Energy & Peak) in Mar 2017 Peak DemandPeak MetRequirementAvailabilityEnergy (MU)RegionDeficit (%)Deficit (%)RegionPower (MW)ChandigarhDelhiHaryanaHPJ&KPunjabRaj asthanUPUtrakhandMar '160100370006310 Mar '17020050900100 ChattisgarhGujaratMPMaharashtraDaman & DiuDadar Nagar HaveliGoaMar '1610729635001 Mar '17655183090016 APTelenganaKarnatakaKeralaTamil NaduPuducherryLakshyadeepMar '1695694121310 Mar '1730490493089. Peak Shortage of Power Supply (MW) in Different Regions02005090010001003700063100400800 ChandigarhDelhiHaryanaHPJ&KPunjabRajasth anUPUtrakhandMWNorthern States (MW)Mar '17 Mar '16655183090016107296350010100200300400 ChattisgarhGujaratMPMaharashtraDaman &DiuDadarNagarHaveliGoaMWWestern States (MW)Mar '17 Mar '16304904930956941213100200400600800 APTelenganaKarnatakaKeralaTamil NaduPuducherryLakshyadeepSouthern State (MW)Mar '17 Mar '16 BiharDVCJ harkhandOdishaWest BengalSikkimA&N IslandMar '16690004808 Mar '170000008 ArunachalAssamManipurMeghalayaMizoramNag alandTripuraMar '1622700203 Mar '17112021090000008690004808020406080 BiharDVCJ harkhandOdishaWestBengalSikkimA&NIslandM WEastern States (MW)Mar '17 Mar '1611202102002030102030 ArunachalAssamManipurMeghalayaMizoramNag alandTripuraMWNorth-Eastern States (MW)
8 SectorMar '16 Mar ' * For Coal and Lignite based Power Plants 10%PLFAll India PLF Month-wise10. All India PLF* Sector-wise for Mar. India % PLFS ector-Wise Plant Load Factor for Mar, 2016 and Mar, 2017 Mar '16 Mar ' India PLF Month-wise2015-162016-172010-112011-1220 12-132013-152014-15T&D (P)AT&C (P)Note: As per PFC for utilities selling directly to consumers P: ProvisionalTotal Number of Villages597464 Pump sets Energised as on 31-03-201620434180 Note: From the year 2004-05 onwards Definition of Village Electrification:-A village would be declared Electrified ifWithout Subsidy Gap ACS-ARR( Without Subsidy) Paise/unitGap ACS-ARR (on subsidy booked basis) paise/unitGap ACS-ARR (on subsidyreceived basis) paise/unit2013-1440011876772014-15412108 5860 Source:- PFC Reports on the performance of State Power Utilities2014-1510102015-161075* # (Gross Generation+Net Import) / Mid Year Population,* Provisional2013-14 ** Actual11518 Yearii) Electricity is provided to Public places like Schools, Panchayat Office, Health Centre, Dispensaries, Community Centres etc.
9 Andiv) Mandatory Certification from Gram Panchayat regarding the completion of village electrification should be Average cost of Power & Average Realisation iii) The number of households electrified should be at least 10% of the total number of households in the village*Disclaimer: The data included in monthly Progress reports of Village electrification published by CEA is provisional in nature as Indicated in all the reports. The data in the report prior to October, 2015 was Updated every month based on the information received from states/distribution utilities as and when reported but the data for all the states for a particular month was generally not made available simultaneously to reflect the countrywide picture for a particular month. Number of total villages and number of electrified villages have also been adjusted for changes observed from Census 2011 data. As such, each monthly report of Village electrification of CEA is independent of the earlier published reports11.
10 T & D and AT&C Losses (%) 12. All India Village Electrification & Pumpsets Energised as on Villiages Electrified (Nos.) as on *% Villages electrified15. All India Coal consumption for Power Generation (MT)52014. All India per capita consumption of Electricity ( KWh) #Average Revenue Realization(paise/unit)20645608 Pump sets Energised as on 31- 03-17 Average cost of supply(ACS) (paise/unit)i) Basic Infrastructure such as Distribution Transformer and Distribution lines are provided in the inhabited locality as well as Dalit Basti / hemlet where it exists. (For electrification through Non-Conventional Energy Sources a Distribution Transformer may not be necessary)Figures are based on the data available in DDUGJY Addition Targets and Achievements in 12th Plan122 Capacity Addition Targets & Achievements during March 2017 and April 2016 to March 2017133 Installed Capacity in various Regions including their B - Capacity Addition (i)Targets(MW)Type/SectorCentralStatePri vateTotalThermal14, , , , , , , , , , , , , , (ii)(MW)Type/SectorCentralStatePrivateTo talThermal15, , , , , , , , , , , , , % Capacity Addtion Targets and Achievements in the 12th Plan12 Achievement of Capacity Addition during the Current Plan upto Mar 2017 Achievements upto Mar, 2017 during the 12th Plan 72, , , , , , , , , , , , , , Plan Target 88,537 MW, Achieved so far MWTargetAchievement(MW)DeviationTarget* AchievementTarget*Achievement(+) / (-)