Transcription of Granite Oil Corp. - cormark.com
1 PROCESS OVERVIEWSNAPSHOTP roduction (March 2018)2,210 boe/d (97% oil)Operating Netback (2017)$ +P Reserves(3) MMboe (83% oil)AER Estimated OOIP(1) MMbblsEstimated EOR Pool OOIP(2) MMbblsDeveloped/Undeveloped Land(5)74,382/64,915 acresLMR (April 2018) Oil Alternatives Process | Overview MemorandumApril 2018 Granite Oil Corp. ( Granite or the Company ) has initiated a formal process to review potential strategic alternativesin an effort to enhance shareholder value. Such strategic alternatives may include, but are not limited to, a sale ormerger of the Company or other form of business combination; a sale or joint venture involving all or a portion of theassets; a recapitalization of the Company or other form of strategic investment; or the purchase of assets Granite has retained Cormark Securities Inc.
2 And National Bank Financial Inc. as its co-financial advisors (individually,or collectively, the Financial Advisors ) to assist in this processOPPORTUNITY HIGHLIGHTS Significant, Delineated Bakken Oil Resource with an Early-Stage Enhanced Oil Recovery ( EOR ) Project Alberta Energy Regulator ( AER ) estimated MMbbls of original oil-in-place ( OOIP )(1)within a 30 mile, 80section delineated oil fairway(2) Proved + Probable Reserves of MMbbls of Bakken oil(3)booked, representing a recovery factor of MMbbls of OOIP(1) Early entry into a sustainable, long-life gas injection EOR project with recovery to date versus recovery based on independent reservoir modeling(4) Current EOR project approved flood area estimated to contain MMbbls of OOIP(2) Top tier Proved Developed Producing ( PDP ) oil reserves replacement.
3 Three consecutive years of decreasingPDP F&D costs and increasing PDP recycle ratios through EOR reserves recognition Large inventory of potential infill drilling locations with significant extension and exploration opportunities(2) 100% Ownership of Land and Facilities Allows forControl of Future Development Ability to ramp up production as oil price increases Facility ownership and capacity allows for futuredevelopment at half-cycle economics No competitive drainage Substantial Free Cash Flow and Strong Balance Sheet Current production (March 2018) of ~2,210 boe/d (97% oil; 29oAPI), strong capital efficiencies and low operatingcost structure provides for significant free cash flow generation(2) Corporate decline estimated at 24%(2) Net debt of $ MM at December 31, 2017 provided for D/2017 CF of , TOP TIER OIL ASSET AT FERGUSON, ALBERTA30 mile Alberta Bakken Oil Fairway1 Highly Economic Drilling Inventory(2) 87 potential infill drilling locations, representing 17years of drilling with average production of ~2,540boe/d (98% oil) ~$11,000/bbl/d (IP365) capital efficiency 48% rate-of-return type curve at WTI US$60/bbl recycle ratio(1)As per AER public pool data as at December 31, 2016(2)As per management estimates as at December 31, 2017(3)As per the Sproule Report as at December 31, 2017(4)
4 As per independent engineering consultant s report dated February 2014(5)Land shown on a Company gross basis as at March 31, 2018AA Strategic Alternatives Process2 DELINEATED 400+ MMBBLS BAKKEN OIL RESOURCE WITH 200+ MMBBLS IN EOR PROJECT AREA 2012 discovery; Gas injection EOR pilot started in 2013with current EOR approval of over sections of the39 section delineated pool The EOR project area is currently producing from 20flowing wells and 35 pumping wells supported by 16 gasinjectors 100% owned and operated land and facilities within a30 mile oil fairway(1)A100/12-08-003-17W4100/07-25-0 03-17W4102/08-24-003-17W4100/14-21-003-1 6W4 A Estimated AER public pool data of MMbbls OOIP(2) Approved EOR project area contains an MMbbls with MMbbls recovered to date(1)(3) 87 potential infill drilling locations on 200 m spacingidentified within current Ferguson development area(3) Granite internal assumptions of ave.
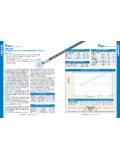
5 , SW 25% Mapping and well logs highlight significant upsidethrough drilling with extensions both east and west14 m(1)As per management estimates(2)As per AER public pool data as at December 31, 2016(3)As at December 31, 2017 Best porosity and permeability in POD 3; yet to be developed under full-scale EORGR (API)0150 GR (API)0150 GR (API)0150 GR (API)0150 0 60 ND Porosity (%)0 60 ND Porosity (%)0 60 ND Porosity (%)0 60 ND Porosity (%)16% Average PorosityCROSS SECTION A-A Granite s early life-cycle Alberta Bakken pool has transitioned into a sustainable, long-life EOR project EOR project implemented in 2015 has resulted in significant improvements to capital and oil recovery efficiencies(1): 78% reduction in annual capital spending; 70% reduction in annual lateral meters drilled; PDP Reserves growth of45%.
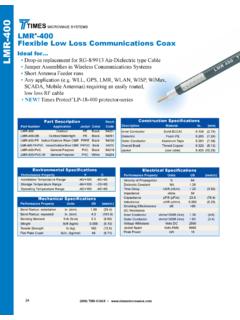
6 And increasing PDP recycle ratios(1) recovery factor to date ( MMbbls of the MMbbls in the EOR area)(1)with a modeled recovery factor on gas-flood pressure maintenance alone(2) Further upside in recoveries from undersaturated oil, CO2and future waterflood potential(1)(2)050 01, 00 01, 50 02, 00 02, 50 03, 00 0 Jan-12 Jan-13 Jan-14 Jan-15 Jan-16 Jan-17 Jan-18 Product i on ( bbl /d)Pod 1 Pod 2 Pod 3 Pod 42011 YE2012 YE2013 YE2014 YE2015 YE2016 YE2017 YETotal Capital ($MM)$ $ $ $ $ $ PDP Reserves (mbbl)2,5265,2594,7024,8755,4766,813 PDP F&D ($/bbl)$ $ $ $ $ $ Development02040608010 012 014 00. 000. 010. 101. 0010 .0 010 0. 001, 00 010 ,0 00. 0019 5819 6019 6219 6419 6619 6819 7019 7219 7419 7619 7819 8019 8219 8419 8619 8819 9019 9219 9419 9619 9820 0020 0220 04 Producing W ell Count Injecting Well CountOil Product ion ( m bbl/d)Gas Product ion ( m m cf /d)Injected Gas (mmcf/d)Injection Gas (mmcf/d)Oi l ( m bb l/ d)Gas (mmcf/d)Producing WellsInjecting WellsANALOGOUS GAS FLOOD EOR DEVELOPMENT PROFILE - SWANSON RIVER POOL, ALASKA(3)Strategic Alternatives ProcessEARLY ENTRY INTO A SUSTAINABLE, LONG-LIFE EOR PROJECT3(1)As per management estimates(2)As per independent engineering consultant s report dated February 2014(3)
7 Swanson River Pool historical production data as per the Alaska Oil and Gas Conservation CommissionEarly Primary DevelopmentInitial drilling, primary production Testing EORR esponding to reservoir behavior; setting up for long-term pool performanceFull-scale EORM aintaining pressure; managing production with reduced drilling and improved, long-term base declineTerminal Pool Decline and Blow DownMaximizing value from an end-of-life poolCurrent Stage of Ferguson Field30% of pool developed under full-scale EOR 53% recovery in 47 years from undersaturated Swanson River PoolInitiated Gas Injection EOR PilotCommence focused EOR Development on Pod 1 Expand focused EOR Development to Pod 2 Pods 3 and 4 supported by flank injection; yet to undergo focused EOR developmentBest porosity and permeability in POD 3; yet to be developed under full-scale EOR05010 015 020 025 030 00 1224364860728496108120A v er age M ont hly Pr oduct ion (bbl/d)Product ion M ont hHistorical Wells (bbl/d)Ty pe Wel l (bb l/ d)Type Well Econom icsEUR ( TPP) : 1 9 8 mb b l sA ll-In-Capex : $ millionHoriz ontal Length: 2,100 m Capital Efficie ncy (IP365): $11,000/bblRoyalty: FH Sliding 5-30%WTI/WCS WTIFX Dif f erential P/INPV 10 IRRIRR*Payout Payout*(US$/bbl)(US$/C$)(US$/bbl)(x)($MM )(%)(%)(Mos.)
8 (Mos.)$50$ $ $ $60$ $ $ $70$ $ $ Alternatives Process4 Early life-cycle pool under EOR with a significant inventory of potential infill drilling locations provides flexibility in self-funded, cash flow generating development programs, ranging from: Slow growth and free cash flow model(1)(2) providing a free cash flow annuity: Grow production to ~2,800 bbl/d with five wells per year over 16 years with average capital spending of$10 million per year, generating cumulative free cash flow of ~$303 million at strip pricing over this period Accelerated growth and free cash flow model(1)(2) maximizing front-end reserves recovery and NPV: Grow production to ~3,640 bbl/d with eight wells per year over 10 years with average capital spending of$15 million per year, generating cumulative free cash flow of ~$193 million at strip pricing over this period Upside potential of 30%+ on cash flow generation with oil blending options to mitigate strip differential pricingLONG TERM, SUSTAINABLE DEVELOPMENT PLANS PROVIDE GROWTH OPTIONALITYSIGNIFICANT RUNNING ROOM WITH DELINEATED EOR DRILLING LOCATIONS 87 potential infill drilling locations identified on 200 m spacing(1)
9 100% owned with no competitive drainage Flexibility in development with years of running room in slow growth or accelerated growth production models Industry leading capital efficienciesfor oil at $11,000/bbl/d Low capital and operating costsallow for continued rate of returneven in a low price environment(1)ECONOMIC TYPE WELL(1)(3)* Based on 2014-2017 average WTI/WCS differential of US$15/bbl(1)As per management estimates(2)Slow growth and accelerated growth models are available in the virtual data room(3)Based on historical production data of all wells producing within the Lower Banff-Exshaw-Big Valley B pool Oil Batteries 8,800 bbl/d capacity (<30% current utilization) 20,000 bbl storage Gas Injection Facilities Tied into natural gas utility system 5,340 Horsepower >20 mmcf/d injection capacity 25 km of injection lines 16 gas injection wells 100% Pipeline-connected 13 km high-pressure system 48 km low-pressure system Gas Plant (16-31-4-21W4)(3) mmcf/d capacity 1,100 HP compressionStrategic Alternatives ProcessMATERIAL EXPLORATION OPPORTUNITIES5100% OWNED FACILITIES AND INFRASTRUCTURE IN PLACE FOR FULL-FIELD DEVELOPMENT Multiple exploration and extension targets over 30 mile oil fairway(1) Acquired 50,000 net acres of additional Bakken lands in 2016 Exploration zones include.
10 Mannville, Livingstone, Bakken, Big Valley all are proven productive in the map areaAER defined pool boundaryFerguson Lower Banff-Exshaw-Big Valley BAER public pool data of MMbbls OOIP(2)(1)As per management estimates(2)As per AER public pool data as at December 31, 2016(3)Located to the north west of the facility mapCapital Structure(000s)Basic Shares Outstanding34,191 Performance-Based Awards Outstanding1,108 Time-Based Awards Outstanding57 Fully Diluted Shares Outstanding35,356 Net Debt (As of December 31, 2017)$39,839 Bank Line$50,000 Current Annualized Dividend Per Share$ (As at December 31, 2017)($MM)COGPE$ $ $ $ and Other$ Issue Costs$ $ Auditors- KPMG LLPI ndependent Engineers- Sproule Associates LimitedLegal Counsel- DLA Piper (Canada) LLPB ankers- Nat ional Bank of Canada- ATB Fi nancial- Bank of Nov a ScotiaLMR (As at April 7, 2018) Category(m bbls)(m bbls)(m m cf)(m boe)Prov ed Developed Producing6,96601,9697,294 Prov ed Developed Non-Producing2161939,7692,037 Prov ed Undeveloped4,81309474,971 Total Proved11,99419312,68514,302 Probable4,300835,0965,232 Proved + Probable16,29527617,78119,534 FutureDevelopmentCapital5%10%15% UndiscountedReserves Cat