Transcription of Graphics in LTEX using TikZ
1 Graphics in LATEX using Tik Z. Zofia Walczak Faculty of Mathematics and Computer Science, University of Lodz zofiawal (at) math dot uni dot lodz dot pl Abstract In this paper we explain some of the basic and also more advanced features of the PGF system, just enough for beginners. To make our drawing easier, we use Tik Z, which is a frontend layer for PGF. 1 Introduction The rule is that all Tik Z graphic drawing com- In this paper we explain some of the basic and also mands must occur as an argument of the \tikz com- more advanced features of the PGF system, just mand or inside a {tikzpicture} environment. The enough for beginners. To make our drawing easier, LATEX version of the {tikzpicture} environment is: we use Tik Z, which is a frontend layer for PGF. The \begin{tikzpicture}[<options>].
2 Commands and syntax of Tik Z were influenced by <environment contents>. such sources as METAFONT, PSTricks, and others. \end{tikzpicture}. For specifying points and coordinates Tik Z pro- All options given inside the environment will vides a special syntax. The simplest way is to use apply to the whole picture. two TEX dimensions separated by commas in round For example, to draw the triangle between the brackets, for example (3pt,10pt). If the unit is not points (0, 0), (0, 2), (2, 0) we can write: specified, the default values of PGF's xy-coordinate \tikz\draw (0,0)--(0,2) -- (2,0)-- (0,0);. system are used. This means that the unit x-vector or goes 1 cm to the right and the unit y-vector goes \begin{tikzpicture}. 1 cm upward. We can also specify a point in the po- \draw (0,0) -- (0,2) -- (2,0)-- (0,0).
3 Lar coordinate system like this: (30:1cm); this means \end{tikzpicture}. go 1 cm in the direction of 30 degrees . To create a picture means to draw a series of which produce: straight or curved lines. using Tik Z we can specify paths with syntax taken from MetaPost. 2 Getting started First we have to set up our environment. To begin with, we set up our file as follows: We can change the thickness of the line with the option line width=<width>, as in: \documentclass{article}. \usepackage{tikz} \tikz\draw[line width=2mm] (0,0) -- (0,4);. \begin{document} For drawing circles and ellipses we can use the Document itself circle and ellipse path construction operations. \end{document} The circle operation is followed by a radius in round brackets while the ellipse operation is fol- Then we start to create pictures.
4 The basic build- lowed by two, one for the x-direction and one for the ing block of all the pictures in Tik Z is the path. y-direction, separated by and and placed in round You start a path by specifying the coordinates of brackets. We can also add an option rotate or the start point, as in (0, 0), and then add a path scale for rotating or scaling ellipse. Some exam- extension operation . The simplest one is just --. ples followed by the corresponding code: The operation is then followed by the next coordi- nate. Every path must end with a semicolon. For drawing the path, we use \draw command which is an abbreviation for \path[draw]. The \filldraw command is an abbreviation for \path[fill,draw]. 176 TUGboat, Volume 29, No. 1 XVII European TEX Conference, 2007. Graphics in LATEX using Tik Z. \tikz\draw[line width=2mm] (0,0).
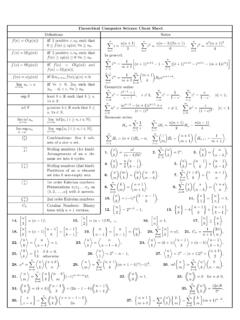
5 Circle (4ex);. \tikz\draw (0,0) ellipse (20pt and 28pt);. \tikz\draw (0,0) ellipse (28pt and 20pt);. \begin{tikzpicture}. \draw ( ,0)--( ,0);. \draw (0, )--(0, );. \draw (1,0) arc (-25:70:1cm);. \tikz\draw[rotate=45] (0,0) \end{tikzpicture}. ellipse (16pt and 20pt);. \tikz\draw[scale= ,rotate=75] (0,0). ellipse (10pt and 16pt);. We also have the rectangle path construction op- \tikz\draw (0,0) arc (0:180:1cm);. eration for drawing rectangles and grid, parabola, sin, cos and arc as well. Below are examples of using these constructions. \tikz \draw[fill=gray!50] (4,0)-- +(30:1cm). arc (30:60:1cm) -- cycle;. \tikz \draw[fill=gray!50] (4,0)-- +(30:2cm). arc (30:60:1cm) -- cycle;. There is a very useful command \tikzstyle which can be used inside or outside the picture en- \begin{tikzpicture}. vironment.
6 With it we can set up options, which \draw[step=.25cm,gray,thick]. will be helpful in drawing pictures. The syntax of (-1,-1) grid (1,1);. this command is \end{tikzpicture}. \tikzstyle<style name>+=[<options>]. We can use it as many times as we need. It is pos- sible to build hierarchies of styles, but you should not create cyclic dependencies. We can also redefine existing styles, as is shown below for the predefined style help lines: \begin{tikzpicture}. \draw ( ,0) -- ( ,0);. \draw (0, ) -- (0, ); \tikzstyle{my help lines}=[gray, \draw (0,0) circle (.8cm); thick,dashed]. \draw (-1,-1) rectangle (1,1); \begin{tikzpicture}. \draw[gray] ( , ) parabola (1,1); \draw (0,0) grid (2,2);. \end{tikzpicture} \draw[style=my help lines] (2,0). grid +(2,2);. The arc path construction operation is useful \end{tikzpicture}.
7 For drawing the arc for an angle. It draws the part of a circle of the given radius between the given angles. If the optional + is given, it means that the new This operation must be followed by a triple in round options are added to the existing definition. It is also brackets. The components are separated by colons. possible to set a style using an option <set style>. The first and second are degrees on the circle and just after opening the tikzpicture environment. the third is its radius. For example, (20 : 45 : 2cm) When we want to apply graphic parameters to means that it will be an arc from 20 to 45 degrees only some path drawing or filling commands we can on a circle of radius 2 cm. use the scope environment. TUGboat, Volume 29, No. 1 XVII European TEX Conference, 2007 177. Zofia Walczak 4 Adding text to the picture For adding text to the picture we have to add node to the path specification, as in the following: B B A B.
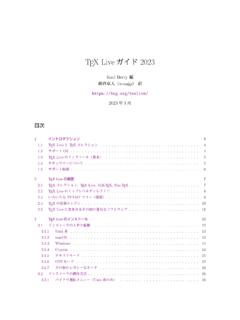
8 A A D C. \tikz\draw (1,1) node{A} -- (2,2) node{B};. \begin{tikzpicture} \tikz\draw (1,1) node[circle,draw]{A} -- \begin{scope}[very thick,dashed] (2,2) node[circle,draw]{B};. \draw (0,0) circle (.5cm); \tikz\draw (0,0) node{D} -- (2,0) node{C}. \draw (0,0) circle (1cm); -- (2,1) node{B} -- (0,1) node{A} --cycle;. \end{scope}. \draw[thin] (0,0) circle ( ); Nodes are inserted at the current position of the \end{tikzpicture} path (points A and B in the first example); the op- tion [circle,draw] surrounds the text by a circle, 3 Filling with color drawn at the current position (second example). using command \fill[color] we can fill with the Sometimes we would like to have the node to given color a domain bounded by any closed curve. the right or above the actual coordinate. This can For closing the current path we can use -- cycle.
9 Be done with PGF's so-called anchoring mechanism. For the color argument, we can use either name of Here's an example: color, for example green, white, red, or we can mix colors together as in green!20!white, meaning that B. we will have 20% of green and 80% of white mixed. A. \begin{tikzpicture}. \draw (1,1) node[anchor=north east,circle, draw]{A} -- (2,2) node[anchor=south west, \begin{tikzpicture} circle,draw]{B};. \draw ( ,0)--( ,0); \end{tikzpicture}. \draw (0, )--(0, );. \fill[gray] (0,0) -- (1,0) arc (0:45:1cm) This mechanism gives us very fine control over the -- cycle; node placement. \end{tikzpicture} For placing simple nodes we can use the label and the pin option. The label option syntax is: label=[<options>]<angle>:<text>. Top My rectangle Bottom \tikz \node[rectangle,draw, label=above:Top,label=below: \tikz\draw[line width=2mm,color=gray].]
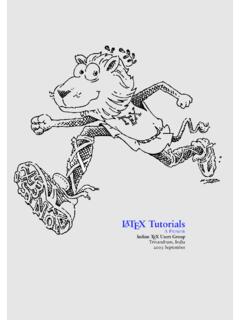
10 Bottom]{my rectangle};. (0,0) circle (4ex);. \qquad When the option label is added to a node oper- \tikz\draw[fill=gray!30!white] (0,0) ation, an extra node will be added to a path contain- ellipse (20pt and 28pt); ing <text>. It is also possible to specify the label \qquad distance parameter, which is the distance addition- \tikz\draw[fill=gray!60!white] (0,0) ally inserted between the main node and the label ellipse (28pt and 20pt); node. The default is 0 pt. 178 TUGboat, Volume 29, No. 1 XVII European TEX Conference, 2007. Graphics in LATEX using Tik Z. 12 6 Plotting functions 12. For plotting functions we have to generate many 9 clock 3 points and for that TEX has not enough computa- 9 3. tional power, but it can call external programs that 6 6 can easily produce the necessary points. Tik Z knows how to call Gnuplot.