Transcription of Graphing Linear Equations
1 Mathematics Enhanced Scope and Sequence Grade 8 Virginia Department of Education 2011 1 Graphing Linear Equations Reporting Category Patterns, Functions, and Algebra Topic Graphing Linear Equations Primary SOL The student will graph a Linear equation in two variables. Materials Large Graph template (attached) Small candy pieces Stained Glass Graph activity sheet (attached) Regular graph paper Rulers Vocabulary coordinate plane, quadrants, axis (earlier grades) Linear equation ( ) Student/Teacher Actions (what students and teachers should be doing to facilitate learning) 1. Distribute small candy pieces and copies of the attached Large Graph template. Review the axes and quadrants and how to graph ordered pairs on the grid. List several ordered pairs for students to graph by placing candy pieces on the grid. 2. Give students a Linear equation, such as y = x + 3. Model how to create a table to graph the equation and then plot the points on a graph, using the candy pieces.
2 Walk around to assist students and check whether they have graphed the points correctly. Give students additional examples of Linear Equations in two variables, and have them make a table and then graph each line . You might choose to have individual students model their graphs for other students to check. 3. Distribute sheets of regular graph paper, rulers, and copies of the Stained Glass Graph activity sheet. Have students work individually to complete the activity sheet by creating tables for the Equations and Graphing the lines on the graph paper. Assessment Questions o What is the difference between the graph of y = x + 3 and the graph of y = x 3? Journal/Writing Prompts o Graph the Linear equation y = 2x + 7. o Write how you would explain to another student how to graph a Linear equation. Extensions and Connections (for all students) Have students create their own Linear Equations to graph. Discuss what is similar and different about the lines in the activity.
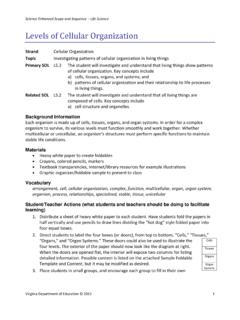
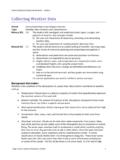
3 Discuss patterns, positive and negative coefficients, and constants and how they affect the graph of the line . Mathematics Enhanced Scope and Sequence Grade 8 Virginia Department of Education 2011 2 Strategies for Differentiation Give students fewer lines for the stained glass Graphing activity, and/or have them use larger graph paper. Begin with integer coefficients and progress to fractional coefficients. Provide students with a sheet of blank tables so they can fill in each table before Graphing . Provide students with the domain for the stained glass Graphing activity. Create a word web to emphasize vocabulary and what the graph of a line will look like. Mathematics Enhanced Scope and Sequence Grade 8 Virginia Department of Education 2011 3 Large Graph Mathematics Enhanced Scope and Sequence Grade 8 Virginia Department of Education 2011 4 Stained Glass Graph Name Date 1.
4 Using regular graph paper, create a table for each equation, and then graph each of the lines. 2. Draw the lines to the edges of your graph paper. 3. Bold each line with a black marker. 4. Color each section a different color. 1. y = 12 x 4 7. y = 12 x + 4 2. y = x + 12 8. y = x + 12 3. y = 12 9. y = 12 4. x = 0 10. y = x 12 5. y = 12 x + 4 11. y = x 12 6. y = 12 x 4