Transcription of Graphing Lines Information Packet: Table of Contents
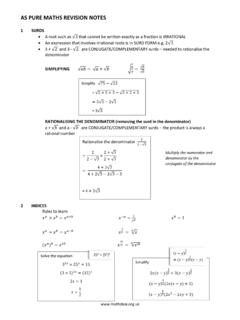
1 Graphing Lines Information Packet: Table of Contents : Graphing Ordered Pairs p. 1 Slope p. 2-4 Horizontal/Vertical Lines p. 5 Graphing Linear Equations p. 6-8 Make a Table p. 6 Intercepts p. 7 Slope Intercept Form p. 8 Writing Equations of Lines p. 9-11 Word Problems Writing Equations p. 12-13 1 Graphing Ordered Pairs Lattice Point: integer coordinate (where the gridlines intersect) Graphing Ordered Pairs Return To Start 2 Slope Slope: the constant rate of change of the rise (vertical change) to the run (horizontal change). *Variable is m. * Put a whole number over 1 to make it into a fraction.
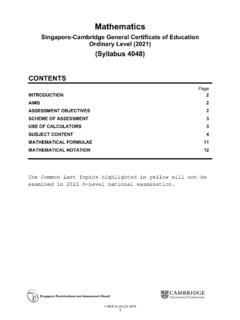
2 4 Types of Slope: Positive Slope: Rises from left to right Examples: 32 4 Going up a hill Negative Slope: Falls from left to right Examples: 12 4 Going down a hill Zero Slope: Horizontal line Y-values are the same Going in a straight line (No Vertical Change) Undefined Slope: Vertical line X-values are the same Falling off a cliff (No Horizontal Change) Slope 4 ~ 41 Return To Start 3 Finding Slope: By Graphing Finding Slope Given a Graph: * Choose any two points on the line . Step 1: Begin at one of the points and count vertically until you are even with the 2nd point. *This is the rise.
3 - If you go down the rise will be negative. - If you go up the rise will be positive. Step 2: Count over until you are at the second point. *This is the run. - If you go left the run will be negative. - If you go right the run will be positive. Step 3: Divide or simplify the fraction to find slope. Given 2 Points: Find the slope of the line that contains (0, 3) and (5, 5). Step 1: Begin at one point. Count vertically until you are even with the 2nd point. *This is the rise. - If you go down the rise will be negative.
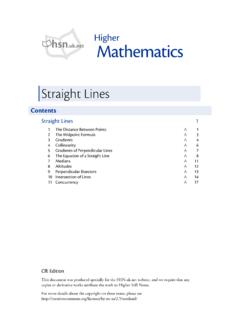
4 - If you go up the rise will be positive. Step 2: Count horizontally to the 2nd point to find the run. *This is the run. - If you go left the run will be negative. - If you go right the run will be positive. Step 3: Divide or simplify the fraction to find slope. Or (It does not matter which point you start with. The slope is the same.) Horizontal and Vertical Lines Horizontal line Vertical line : Slope by Graphing 4 Finding Slope: Formula Finding Slope Given a Graph: Step 1: Label Coordinates: Let (0, 2) be (x1, y1) and ( 2, 2) be (x2, y2).
5 Step 2: Substitute: Step 3: Simplify Given 2 points: Find the slope of the line that contains (2, 5) and (8, 1). Step 1: Label Coordinates: Step 2: Substitute: Step 3: Simplify From A Table : Step 1: Pick 2 points from the Table and Label Coordinates: (0, 1) and (-2, 5). Step 2: Substitute: Step 3: Simplify Horizontal and Vertical Lines Horizontal line : Vertical line : Slope Formula x1 y1 x2 y2 x1 y1 x2 y2 0 -3 = 0 = = err -3 0 = Return To Start 5 Horizontal and Vertical Lines Horizontal Lines Equation: y = y-coordinate parallel to the x-axis.
6 Slope is Zero Vertical Lines Equation is x = x-coordinate parallel to y-axis Slope is undefined Horizontal and Vertical Lines Example: Equation: y = 4 Table : All y-values are the same Graph: Has a y- intercept Example: Equation: x = -2 Table : All x-values are the same Graph: No y- intercept Return To Start 6 Graphing a Linear Equation Make A Table Example 2: Steps Example Step 1: Make a t-chart Step 2: Pick in 3-5 values for x. *Use (-2, 0, 2) to start unless it is a real life problem.
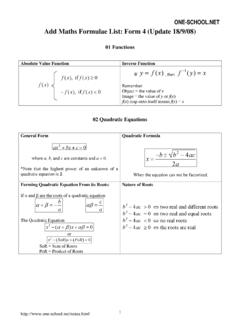
7 * If slope is a fraction use the + & denominator and 0 Step 3: Substitute each value for x and solve for y. Step 4: Record ordered pairs in Table . Step 5: Graph the points and draw the line . y = x + 2 y = 43 (-3) + 2 y = -2 y = 43 (0) + 2 y = 2 y = 43 (3) + 2 y = 6 x y -3 -2 0 2 3 6 Example 1: Steps Example Step 1: Make a t-chart Step 2: Pick in 3-5 values for x. *Use (-2, 0, 2) to start unless it is a real life problem. Step 3: Substitute each value for x and solve for y. Step 4: Record ordered pairs in Table .
8 Step 5: Graph the points and draw the line . 2x - 2y = 6 x y -2 -5 0 -3 2 -1 2 (-2) 2y = 6 -4 2y = 6 +4 +4 -2y = 10 -2 -2 y = -5 2 (0) 2y = 6 -2y = 6 -2 -2 y = -3 2 (2) 2y = 6 4 2y = 6 - 4 - 4 -2y = 2 -2 -2 y = -1 Graphing Lines by Making a Table Return To Start 7 Graphing a Linear Equation Intercepts: The x-intercept is where the graph crosses the x-axis. The y-coordinate is always 0. The y-intercept is where the graph crosses the y-axis. The x-coordinate is always 0.
9 Graphing Lines by Finding the Intercepts: Steps Example Step 1: Find y-intercept Let x = 0 Substitute 0 for x; solve for y. Graph the point on the y-a- xis. Step 2: Find x-intercept Let y = 0 Substitute 0 for y; solve for x. Graph the point on the x-a- xis. Step 3: Connect the dots. 2x - 2y = 8 S1) Let x= 0 2 (0) 2y = 8 2y = 8 -2 -2 y = -4 Ordered pair: (0, -4) S2) Let y = 0 2x 2( 0) = 8 2x = 8 2 2 x = 4 Ordered pair: (4, 0) Graphing Lines by Finding Intercepts Return To Start 8 Graphing a Linear Equation Slope Intercept Form: y = m x + b y-coordinate Slope: rate of change (rise/run) x-coordinate y-intercept: point where line crosses the y-axis Graph Using SLOPE and Y-INTERCEPT: Example 1: Equation in Slope Intercept Form Steps Example Step 1.
10 Identify the y-intercept (b) and plot the point (0, b) Step 2: Use the slope (m) to find a second point: (Put a whole number over 1 to make it a fraction: 2 = ( 21 ) Step 3: Connect the points y = 43 x + 1 b= 1 m = 43 Example 2: Equation NOT in Slope Intercept Form Graphing Lines Using Slope Intercept Form Represent an ordered pair on the line . Return To Start 9 Writing Equations of Lines To write an equation of a line you need the slope and y-intercept. Slope Intercept Form: y = m x + b y-coordinate Slope: rate of change (rise/run) x-coordinate y-intercept: point where line crosses the y-axis Skeleton Equation: y = x + (Fill in the slope and y-intercept) Graph: What to do: (Steps) Example 1.)