Transcription of Graphs and charts - quiz - BBC
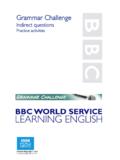
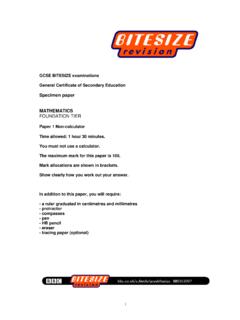
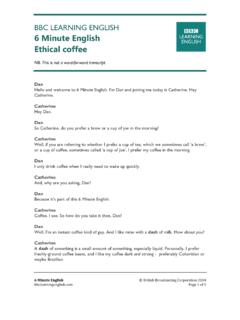
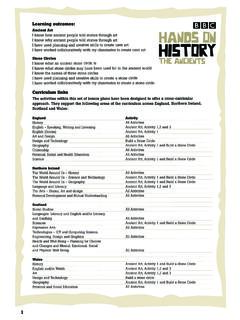
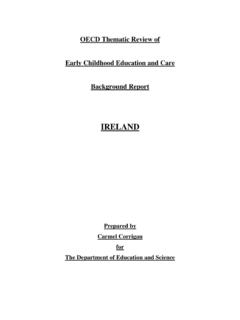
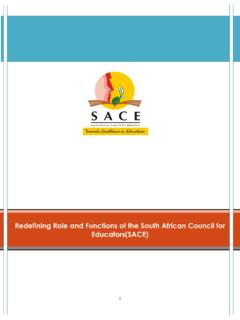
1 BBC 2011 Graphs and charts - quiz L1 Level A Look at the graph of monthly average temperatures recorded in Jamaica over a year. 1. Which month had the highest average temperature? A) June B) July C) August 2. Which month had the lowest average temperature? A) January B) February C) March 3. April and May have the same average temperature as June and July. A) True B) False BBC 2011 Graphs and charts - quiz L1 Look at the chart of car sales. 4. Which make of car was the most popular? A) Nissan B) Vauxhall C) Peugeot D) Toyota 5. Which 2 makes of car sold over 150 each? A) Toyota and MG Rover B) Toyota and Vauxhall C) Vauxhall and Peugeot D) Peugeot and MG Rover 6. Which was the lowest selling make?
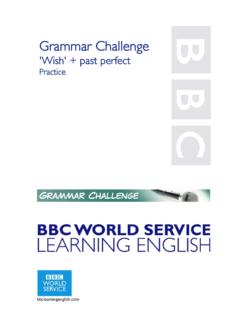
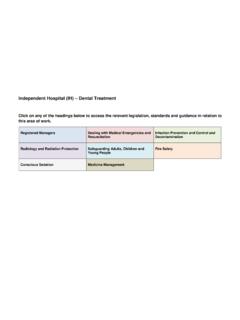
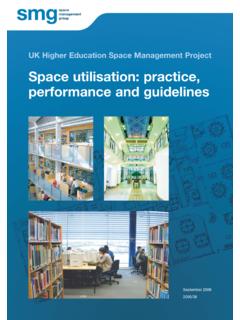
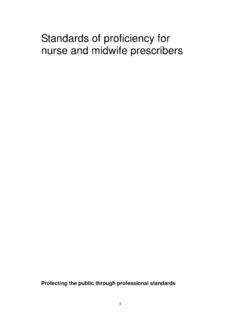
2 A) Land Rover B) BMW C) Jaguar BBC 2011 Graphs and charts - quiz L1 7. Here's how I spent the past 24 hours? Match the table and pie chart to find out what I spent the most time on. A) working B) sleeping C) getting dressed 8. I spent more time on meals than travel and getting dressed combined. A) True B) False 9. I spent less time watching TV than on doing my household chores. A) True B) False 10. What did I spend the least amount of time doing? A) swimming B) getting dressed C) household chores BBC 2011 Graphs and charts - quiz L1 Level B 1. Choose the graph that best fits with this statement: "House prices rose in January and February, fell slightly in March and are now holding steady ".
3 A. B. C. D. 2. Choose the graph that best fits with this statement: "The TV licence has been frozen for the next 3 years". A. B. C. D. 3. Choose the graph that best fits with this statement: "This car has excellent acceleration". A. B. C. D. 4. Choose the graph that best fits with this statement: "The price of groceries is still rising". A. B. C. D. BBC 2011 Graphs and charts - quiz L1 5. Look at the Venn diagram. Which country is in the United Kingdom but not in Great Britain? A) northern ireland B) Republic of ireland C) ireland 6. Look at the Venn diagram. How many countries are in included in the United Kingdom? A) 6 B) 5 C) 4 7. From the Venn diagram, can you identify the 2 nations that make up the british Isles?
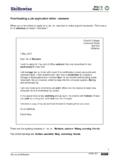
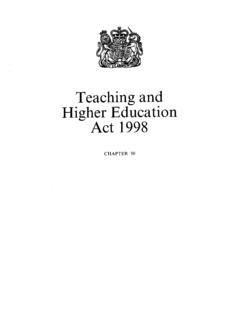
4 A) Great Britain and United Kingdom B) United Kingdom and northern ireland C) Republic of ireland and northern ireland D) United Kingdom and the Republic of ireland 8. Look at the Venn diagram. northern ireland is part of ireland as well as the United Kingdom. A) True B) False BBC 2011 Graphs and charts - quiz L1 9. What service does the Council spend on the most? A) Cultural, Environmental and Planning Services B) Education Services C) Adult Community Care 10. What percentage of the Council's income is spent on Education? A) less than 15% B) more than on Children and Families C) less than on "other" services BBC 2011 Graphs and charts - quiz L1 Level C 1. We collected data about the colour of shoes worn by 30 adults in a group.
5 From the bar chart , find the second most popular colour of shoes amongst men A) Black B) Brown C) Red 2. From the bar chart , find the second most popular colour of shoes amongst women. A) Black B) Brown C) Red 3. From the bar chart , how many adults wore white shoes? A) 1 B) 2 C) 3 4. From the bar chart , find the total number of women who took part in the survey of shoe colours A) 30 B) 17 C) 15 D) 13 BBC 2011 Graphs and charts - quiz L1 5. Which of these statements best describes what is shown in the graph ? A) The number of learners we ve had in our college has dropped significantly over the last five years B) There has been a small decrease in the number of learners in our college over the last five years C) There has been no significant change in the number of learners in the last five years 6.
6 From the graph , what was the decrease in the number of learners between Years 1 and 2? A) 10 B) 15 C) 20 7. There was a small increase in numbers between Years 2 and 3 (see image above). A) True B) False 8. Which of these statements best describes what is shown in the graph ? A) The number of learners we ve had in our college has dropped by over a 100 over the last five years B) There has been a small increase in the number of learners in our college over the last five years C) There has been no significant change in the number of learners in the last five years BBC 2011 Graphs and charts - quiz L1 9. The number of learners in year 1 was A) 600 B) 500 C) 550 10. The number of learners in year 5 (see image above) was A) 550 B) 499 C) 510 BBC 2011 Graphs and charts - quiz L1 Answers Level A Look at the graph of monthly average temperatures recorded in Jamaica over a year.
7 1. Which month had the highest average temperature? The correct answer is: C. August . The peak point in the graph is for the month of August 2. Which month had the lowest average temperature? The correct answer is: B. February. The lowest point of the graph is in the month of February 3. April and May have the same average temperature as June and July . The correct answer is: B. False. April and May have the same average temperature as November and December. BBC 2011 Graphs and charts - quiz L1 Look at the chart of car sales. 4. Which make of car was the most popular? The correct answer is: A. Nissan. It outsold all the other make of cars. 5. Which 2 makes of car sold over 150 each?
8 The correct answer is: C. Vauxhall and Peugeot. You can see that the bars for these makes, extend over the 150 mark. 6. Which was the lowest selling make? The correct answer is: C. Jaguar. The bar for this make is the smallest of all. BBC 2011 Graphs and charts - quiz L1 7. Here's how I spent the past 24 hours? Match the table and pie chart to find out what I spent the most time on. The correct answer is: A. Working. I spent an hour more at work than I did sleeping. 8. I spent more time on meals than travel and getting dressed combined. The correct answer is: B. False I spent exactly the same amount of time on meals ( hours) as getting dressed and travel combined ( + = hours) 9.
9 I spent less time watching TV than on doing my household chores. The correct answer is: B. False. In fact I spent MORE time watching TV ( hours) than on chores ( hours) 10. What did I spend the least amount of time doing? The correct answer is: B. getting dressed I spent only half an hour ( ) getting dressed whereas I spent three quarters of an hour ( ) swimming. BBC 2011 Graphs and charts - quiz L1 Level B 1. Choose the graph that best fits with this statement: "House prices rose in January and February, fell slightly in March and are now holding steady ". A. B. C. D. The correct answer is: D. The graph shows the line rising, then falling and finally flattening out. 2. Choose the graph that best fits with this statement: "The TV licence has been frozen for the next 3 years".
10 A. B. C. D. The correct answer is: A. graph A is a horizontal straight line confirming that that there has been no rise or fall in cost. 3. Choose the graph that best fits with this statement: "This car has excellent acceleration". A. B. C. D. The correct answer is: C. The straight line shows that the car steadily picks up speed from a standstill position. 4. Choose the graph that best fits with this statement: "The price of groceries is still rising". A. B. C. D. The correct answer is: B. The line in this graph is rising upwards. You might have thought that it could have been C, but the price of groceries could not be zero. BBC 2011 Graphs and charts - quiz L1 5. Look at the Venn diagram. Which country is in the United Kingdom but not in Great Britain?