Transcription of Graphs of Polar Equations - Alamo Colleges District
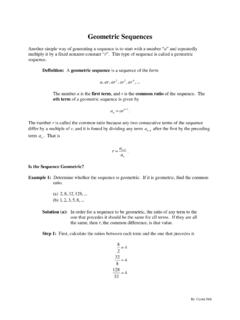
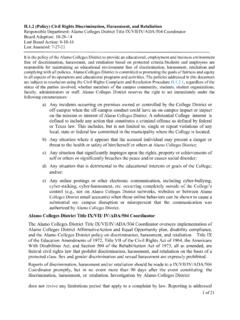
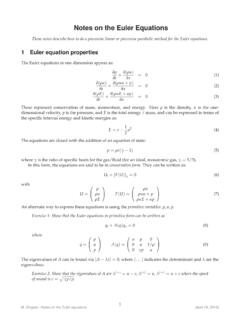
1 Graphs of Polar Equations In the last section, we learned how to graph a point with Polar coordinates (r, ). We will now look at graphing Polar Equations . Just as a quick review, the Polar coordinate system is very similar to that of the rectangular coordinate system. In a Polar coordinate grid, as shown below, there will be a series of circles extending out from the pole (or origin in a rectangular coordinate grid) and five different lines passing through the pole to represent the angles at which the exact values are known for the trigonometric functions. Graphing a Polar equation is accomplished in pretty much the same manner as rectangular Equations are graphed. They can be graphed by point-plotting, using the trigonometric functions period, and using the equation s symmetry (if any).
2 When graphing rectangular Equations by point-plotting you would pick values for x and then evaluate the equation to determine its corresponding y value. For a Polar equation, you would pick angle measurements for and then evaluate the equation to determine its corresponding r value. Symmetry tests for Polar coordinates 1. Replace with - . If an equivalent equation results, the graph is symmetric with respect to the Polar axis. 2. Replace with - and r with -r. If an equivalent equation results, the graph is symmetric with respect to = 2 . 3. Replace r with -r. If an equivalent equation results, the graph is symmetric with respect to the pole. Note: It is possible for a Polar equation to fail a test and still exhibit that type of symmetry when you finish graphing the function over a full period.
3 When you started to graph functions (in rectangular form) you stared by learning the basic shapes of certain functions such as lines, parabolas, circles, square roots, and absolute value functions just to name a few. Polar Equations also have some general types of Equations . Learning to recognize the formulas of these Equations will help in sketching the Graphs . Circles in Polar Form 1. r = a cos is a circle where a is the diameter of the circle that has its left-most edge at the pole. 2. r = a sin is a circle where a is the diameter of the circle that has its bottom-most edge at the pole. Lima ons (Snails) 1. r = a b sin , where a > 0 and b > 0 2. r = a b cos , where a > 0 and b > 0 The lima ons containing sine will be above the horizontal axis if the sign between a and b is plus or below the horizontal axis if the sign if minus.
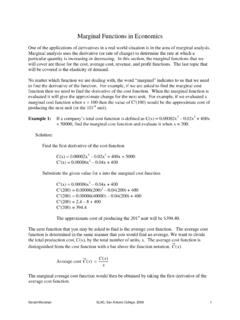
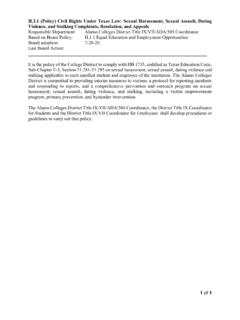
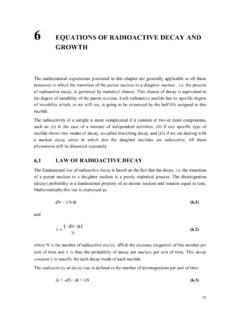
4 If the lima on contains the function cosine then the graph will be either to the right of the vertical axis if the sign is plus or to the left if the sign is minus. The ratio of ab will determine the exact shape of the lima on ab < 1 ab = 1 1 < ab < 2 ab 2 r = a + b sin r = a b sin The Graphs of lima ons with cosine would have similar shapes but along the horizontal axis. Rose Curves A rose curve is a graph that is produced from a Polar equation in the form of: r = a sin n or r = a cos n , where a 0 and n is an integer > 1 They are called rose curves because the loops that are formed resemble petals. The number of petals that are present will depend on the value of n. The value of a will determine the length of the petals.
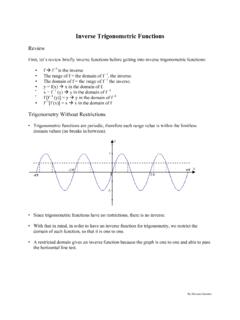
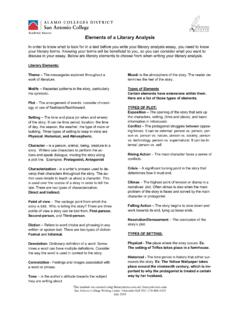
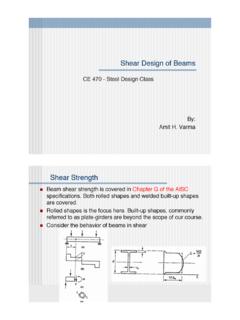
5 If n is an even integer, then the rose will have 2n petals. r = a sin 2 r = a cos 4 If n is an odd integer, then the rose will have n petals. r = a sin 5 r = a cos 3 Lemniscates The last type of Polar equation that we will cover here is the lemniscates, which has the shape of a figure-8 or a propeller. Lemniscates have the general Polar equation of: r2 = a2 sin 2 or r2 = a2 cos 2 , where a 0 A lemniscate containing the sine function will be symmetric to the pole while the lemniscate containing the cosine function will be symmetric to the Polar axis, to = 2 , and the pole. r2 = a2 sin 2 r2 = a2 cos 2 Example 1: Graph the Polar equation r = 1 2 cos . Solution: Identify the type of Polar equation The Polar equation is in the form of a lima on, r = a b cos.
6 Find the ratio of abto determine the equation s general shape ab = 12 Since the ratio is less than 1, it will have both an inner and outer loop. The loops will be along the Polar axis since the function is cosine and will loop to the left since the sign between a and b is minus. Example 1 (Continued): Test for symmetry Polar axis = 2 Pole r = 1 2 cos r = 1 2 cos (- ) r = 1 2 cos r = 1 2 cos -r = 1 2 cos (- ) -r = 1 2 cos r = 1 + 2 cos r = 1 2 cos -r = 1 2 cos r = 1 + 2 cos Passes symmetry test Fails symmetry test Fails symmetry test Evaluate r at different values of Since the equation passes the test for symmetry to the Polar axis, we only need to evaluate the equation over the interval [0, ] and then reflect the graph about the Polar axis.
7 R = 1 2 cos (r, ) 0 1 2 cos 0 = 1 2 * 1= 1 2 = -1 (0, -1) 6 1 2 cos 6 = 1 2 * 32 = 1 3 (6 , ) 4 1 2 cos 4 = 1 2 * 22 = 1 2 (4 , ) 3 1 2 cos 3 = 1 2 * 12 = 1 1 = 0 (3 , 0) 2 1 2 cos 2 = 1 2 * 0 = 1 0 = 1 (2 , 1) Example 1 (Continued): r = 1 2 cos (r, ) 23 1 2 cos 23 = 1 2 * 12 = 1 + 1 = 2 (23 , 2) 34 1 2 cos 34 = 1 2 * 22 = 1 + 2 (34 , ) 56 1 2 cos 56 = 1 2 * 32 = 1 + 3 (56 , ) 1 2 cos = 1 2 * -1 = 1 + 2 = 3 ( , 3) Plot the points Example 1 (Continued): Use the symmetry to complete the graph Example 2: Graph the Polar equation r = 3 cos 2.
8 Solution: Identify the type of Polar equation The Polar equation is in the form of a rose curve, r = a cos n . Since n is an even integer, the rose will have 2n petals. 2n = 2(2) = 4 petals Test for symmetry Polar axis = 2 Pole r = 3 cos 2 r = 3 cos 2(- ) r = 3 cos (-2 ) r = 3 cos 2 r = 3 cos 2 -r = 3 cos 2(- ) r = -3 cos (-2 ) r = 3 cos 2 r = 3 cos 2 -r = 3 cos 2 r = 3 cos 2 Passes symmetry test Fails symmetry test Fails symmetry test Example 2 (Continued): Evaluate r at different values of r = 3 cos 2 (r, ) 0 3 cos 2(0) = 3 * 1= 3 (0, 3) 6 3 cos 2(6 ) = 3 cos 3 = 3 * 12 = 32 (6 ,32) 4 3 cos 2(4 ) = 3 cos 2 = 3 * 0 = 0 (4 , 0) 3 3 cos 2(3 ) = 3 cos 23 = 3 * 12 = 32 (3 , 32 ) 2 3 cos 2(2 ) = 3 cos = 3 * -1 = -3 (2 , -3) 23 3 cos 2(23 ) = 3 cos 43 = 3 * 12 = 32 (23 , 32 ) 34 3 cos 2(34 ) = 3 cos 32 = 3 * 0 = 0 (34 , 0) Example 2 (Continued): 56 3 cos 2(56 ) = 3 cos 53 = 3 * 12 = 32 (56 , 32) 3 cos 2( ) = 3 * 1 = 3 ( , 3) These points will provide us with enough points to complete the rest of the graph using the symmetry of the rose curve.
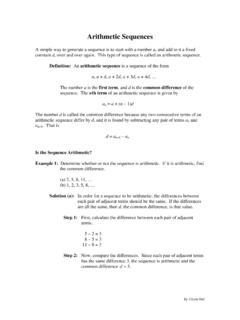
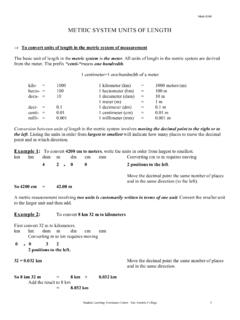
9 Plot the points Example 2 (Continued): Use the symmetry to complete the graph