Transcription of GROUND WATER SCENARIO IN INDIA
1 GROUND WATER SCENARIO IN INDIA . JANUARY, 2016. CENTRAL GROUND WATER BOARD. MINISTRY OF WATER RESOURCES. GOVT OF INDIA . CENTRAL GROUND WATER BOARD. MINISTRY OF WATER RESOURCES. GOVT OF INDIA . 0. GROUND WATER LEVEL SCENARIO IN INDIA . (JANUARY - 2016). Contents Page no. 1. Introduction 2. 2. Rainfall Pattern 2. 3. GROUND WATER Level SCENARIO in INDIA 5. 4. State-wise SCENARIO of GROUND WATER level and comparison 13. with previous year WATER level as well as change with respect to decadal average Andhra Pradesh 13. Arunachal Pradesh 13. Assam 14. Bihar 15. Chandigarh 16. Chhattisgarh 17. Delhi 18. Goa 19. Gujarat 20. Haryana 21. Himachal Pradesh 22. Jammu & Kashmir 23. Jharkhand 24. Karnataka 25. Kerala 26. Madhya Pradesh 27. Maharashtra 28. Meghalaya 29. Odisha 29. Pondicherry 30. Punjab 31. Rajasthan 32. Tamil Nadu 33. Telangana 34. Tripura 35. Uttar Pradesh 36. Uttarakhand 37. West Bengal 37. 1. Introduction GROUND WATER regime monitoring is one of the key activities of CGWB to generate information on GROUND WATER level/ quality through representative sampling.
2 The primary objective of establishing the GROUND WATER monitoring network stations is to record the response of GROUND WATER regime to the natural and anthropogenic stresses of recharge and discharge parameters with reference to geology, climate, physiography, land use pattern and hydrologic characteristics. GROUND WATER levels are being monitored throughout the Country four times in a year by Central GROUND WATER Board through a network of 22339 monitoring wells during the months of January, Premonsoon (March/April/ May), August and January. The GROUND WATER regime monitoring was started in the year 1969 by Central GROUND WATER Board. At present CGWB has a network of 22339 GROUND WATER observation wells, out of which 16190. observation wells are dugwells and 6149 are piezometers. The WATER level / piezometric head data collected from these observations were entered into the National database and are analysed for obtaining background information of GROUND WATER regime and changes on regional scale.
3 The Groundwater level data has been collected from all the states except for Mizoram & Sikkim and UT. of Lakshadweep where WATER level monitoring is not being carried out. WATER level data of January 2016 has been analysed to illustrate spatial distribution of WATER level and its categorization under different ranges. The January data has been compared with the previous year January data (annual fluctuation), with Premonsoon data (Seasonal Fluctuation) and mean of last 10 years January monitoring data (decadal fluctuation); the analytical results are represented through tables and maps along with suitable explanations. Database thus generated forms the basis for planning the GROUND WATER development and management programme. This data is also used for assessment of GROUND WATER resources and establishing changes in the regime consequent to various development and management activities. Rainfall Pattern WATER level / Piezometric heads are resultant of all input/ output from the aquifer.
4 Apart from draft of GROUND WATER for various purposes, quantum of rainfall and its component being recharged to the GROUND WATER is major controlling factor of the depth to WATER levels and it's annual, seasonal or decadal fluctuations. Thus, study of rainfall pattern is very important for understanding spatial and temporal variations in WATER levels. As per the Climatic bulletins of IMD for monsoon period of 2015, the rainfall pattern has been studied and discussed below. 2. For the country as a whole, cumulative rainfall during the year's monsoon has been 12% below the Long Period Average (LPA). Regions Actual Rainfall (mm) Normal Rainfall (mm) % Departure from LPA. Country as a whole -12%. Northwest INDIA -21%. Central INDIA -10%. South Peninsula -7%. East & northeast -12%. INDIA Out of 36 meteorological subdivisions, the rainfall has been excess over 1, normal over 23, deficient over 12 sub-divisions and no sub-division under scanty rainfall.
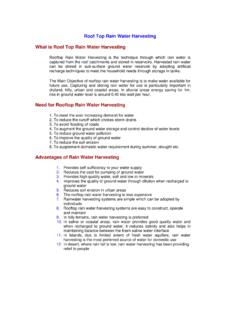
5 Haryana, Chandigarh &. Delhi, Punjab and West Uttar Pradesh received deficient rainfall by more the 50% of LPA. In area- wise distribution, 3% area of the country received excess, 67% normal and remaining 30% area received deficient rainfall. Main Features of Southwest Monsoon, 2015. Southwest monsoon set in over Kerala on June 2015, as against forecast date of 5 June 4. days Observed rainfall for the country as a whole during the month of July & January was 90% &. 91% of the LPA against the forecast of 93% 9% & 96% 9% of LPA respectively The seasonal rainfall for the country as a whole has been 88% of the LPA as against updated Long Range Forecast of 87% 4% of LPA. 3. Source: 4. Plate-II. Source: National Data Centre, CGWB, Faridabad 5. GROUND WATER Level SCENARIO in INDIA GROUND WATER Level SCENARIO - January 2016. The GROUND WATER level data for January 2016 indicate that out of the total 14974 wells analysed, 1371(9 %) wells are showing WATER level less than 2 m bgl (metres below GROUND level), 4958 (33%) wells are showing WATER level in the depth range of 2-5 m bgl, 5342 (36 %) wells are showing WATER level in the depth range of 5-10 m bgl, 2498 (17%) wells are showing WATER level in the depth range of 10-20 m bgl, 607(4%).
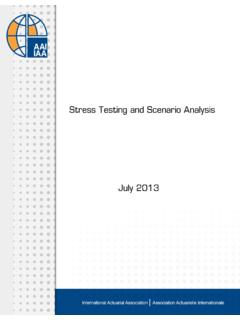
6 Wells are showing WATER level in the depth range of 20-40 m bgl and the remaining 198 (1 %) wells are showing WATER level more than 40 m bgl. The distribution of number of wells under different depth ranges is presented in the histogram (Fig-1) and statistical distribution is given in Annexure-I. The maximum depth to WATER level of m bgl is observed in Bikaner district of Rajasthan whereas the minimum is less than 1 m bgl. The depth to WATER level map of January 2016 (Plate II) for the country indicates that in general depth to WATER level ranges from 2 to 10 m bgl as observed at about more than 65% of the monitoring stations. Sub- Himalayan area, north of river Ganges, northern parts of Uttar Pradesh, northern parts of Bihar, Odisha, Assam, Andhra Pradesh, coastal parts of Maharashtra, and Tripura generally the depth to WATER level varies from 2-5 meter below GROUND level. Shallow WATER level of less than 2 m bgl is observed in the states of Assam and isolated pockets in Andhra Pradesh, Maharashtra, Odisha and Tamil Nadu.
7 In West Bengal WATER level generally varies from 2 to 10 m bgl and central parts of the state shows WATER level of 10 m and above and deeper WATER level of more than 20 m bgl in small pockets. In major parts of north-western states depth to WATER level generally ranges from 10-40 m bgl. WATER level of more than 40 m bgl is also prevalent in the north western part of the country. In the western parts of the country deeper WATER level is recorded in the depth range of 20-40 m bgl and more than 40 m bgl. In some parts of Haryana, and Delhi and almost major parts of Rajasthan, WATER level of more than 40 m bgl is recorded. Along the eastern coast WATER level is generally upto 5 m bgl whereas in the western coast WATER level of 10 m bgl is prevalent. In Central INDIA WATER level generally varies between 5 m bgl to 20 m bgl, except in isolated pockets where WATER level of less than 5 m bgl has been observed. The peninsular part of country generally recorded a WATER level in the range of 2 to 20 m bgl depth range.
8 Fig 1. 6. Plate III. Source: National Data Centre, CGWB, Faridabad 7. WATER Level Fluctuation (January 2016 to January 2015). The WATER level fluctuation of January 2016 to January 2015 shows that out of 13244 wells analysed, 4570 (35%) are showing rise and 8446 (64%) are showing fall in WATER level. Remaining 228 (2%) stations analysed do not show any change in WATER level. About 27% wells are showing rise in the WATER level in the range of less than 2 m. About 4% wells are showing rise in WATER level in 2-4 m range and 3 % wells showing rise in WATER level more than 4 m range. About 64% wells are showing decline in WATER level, out of which 47% wells are showing decline in WATER level in less than 2 m range. About 10 % wells are showing decline in WATER level in 2-4 m range and 7% wells are showing decline in WATER level more than 4 m range (Fig-2 and Annexure-II). Majority of the wells showing rise/decline falls in the range of 0-2 m.
9 A comparison of depth to WATER level of January 2015 to January 2014 is presented in the form of WATER level fluctuation map (Plate III) reveals that in general, there is fall in WATER level in almost the entire country, except in few states such as Assam, Andhra Pradesh, Gujarat, Kerala, Karnataka, Rajasthan and Tamil Nadu. Rise in WATER level in isolated pockets is observed in the states of Madhya Pradesh, West Bengal, Haryana, and Maharashtra. Fall is mostly in the range of 0-2 m, although fall in the range of more than 2 m is also prevalent in all the states in small patches. Fall of more than 4 m is prominent in the states of Andhra Prdesh, Gujarat, Karnataka, Madhya Pradesh, Maharashtra, Rajasthan, Telangana and West Bengal. Fig 2. 8. 9. WATER Level Fluctuation (January 2016 to Premonsoon 2015). The WATER level fluctuation of January 2016 to Premonsoon 2015 indicates that out of 13341 wells analysed, 8521 (64%) are showing rise and 4523 (34%) are showing fall in WATER level.
10 Remaining 297 (2%) wells analysed do not show any change in WATER level. About 45% wells are showing rise in the WATER level in the range of less than 2 m. About 12% wells are showing rise in WATER level in 2-4 m range and 7 % wells showing rise in WATER level more than 4 m range. About 34% wells are showing decline in WATER level, out of which 26% wells are showing decline in WATER level in less than 2 m range. About 5 % wells are showing decline in WATER level in 2-4 m range and 3% wells are showing decline in WATER level more than 4 m range (Fig-3 and Annexure-IV). Majority of the wells showing rise/decline falls in the range of 0-2 m. A comparison of depth to WATER level of January 2016 with Premonsoon 2015 is presented in the form of WATER level fluctuation map (Plate III) reveals that in general, there is rise in WATER level in almost the entire country, except in few states. Rise in WATER level is prominent in all the states of the country except Punjab and Uttar Pradesh and to some extent in Rajasthan.