Transcription of Guidelines for Monitoring Elk and Mule Deer Numbers in …
1 To find more resources for your business, home, or family, visit the College of Agricultural, Consumer and Environmental Sciences on the World Wide Web at for Monitoring Elk and Mule Deer Numbers in New mexico Circular 664 Louis C. Bender1 Cooperative Extension Service College of Agricultural, Consumer and Environmental Sciences INTRODUCTIONW ildlife (hunting) enterprises are impor-tant sources of revenue for property own-ers in New mexico , and consequently elk (Cervus elaphus) and mule deer (Odocoileus hemionus) are vital economic resources for private landowners (Figure 1).
2 Sustainable management of these resources requires accurate Monitoring of populations. This is particularly true in arid habitats where annual changes in population productivi-ty, and thus sustainable harvest and trophy quality, can be pronounced (Heffelfinger et al., 2003; Bender, 2011).Many methods have been used to monitor the status, composition, and trends of deer and elk populations. Methods range from trend indices, which provide information on whether a population is increasing, stable, or de-clining, to abundance estimators, which provide a population estimate (Lancia et al.)
3 , 1996). Population estimates are preferable to trend estimators for several reasons. First, they allow direct calculation of harvestable surplus. Population estimates can also be converted to densities, and relationships between resource availability (forage, etc.) and population size can be determined. Ultimately, it is the per capita resource (food, water) availability that determines individual body condition and thus population productivity, harvestable surplus, and animal (trophy) quality (Bender, 2011). The most common trend indices used by land-owners include minimum counts, spotlight or ground counts, and pellet group surveys.
4 Unfortu-nately, most of these commonly used trend indices have many assumptions that usually result in trend information of uncertain value, and very few have been calibrated to actual population size (Keegan et al., 2011). Consequently, these methods are seldom used by management agencies to monitor populations because of the inherent problems and inaccuracies in these methods. For population esti-mates, the most commonly used and probably best method is an aerial sight-bias (sightability) model (Samuel et al.)
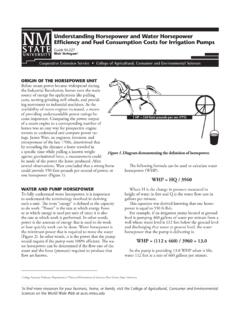
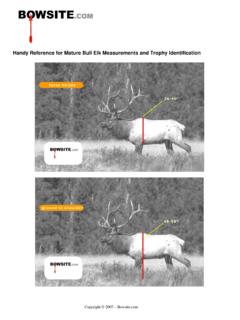
5 , 1987; Otten et al., 1993). Sightability model surveys can be expensive to conduct because they require the use of a helicopter (Figure 2), but 1 Senior Research Scientist (Wildlife), Department of Extension Animal Sciences and Natural Resources, New mexico State 1. Wildlife such as mule deer can contribute significantly to ranch income through well-managed wildlife hunting enterprises. Managing populations for optimal yields requires accurate Monitoring of population size and composition. Photo courtesy of E.
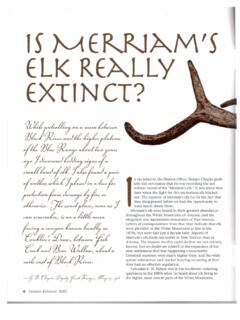
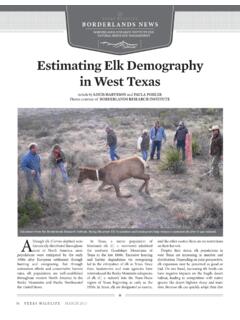
6 Watters. Circular 664 Page 2 Figure 3. Individuals in groups are often not seen during surveys for a variety of reasons, including some individuals in a group being obscured by topography, vegetation, etc. Sightability models correct groups of elk or deer seen during surveys for groups missed using the group characteristics most important to detection. For both elk and mule deer, detection is driven by size of the group. However, even large groups can have individuals missed. For elk, the likelihood of seeing all individuals reaches approximately 100% at a group size of 19, much larger than most people would predict.
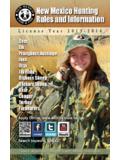
7 Photo courtesy of E. Watters. Figure 2. Use of a helicopter provides many advantages for wildlife surveys. Herding individuals, viewing from many different angles, and low flight capability all greatly increase the accuracy of herd composition counts. Photo courtesy of M. probably produce the best data for manage-ment of deer and elk populations and are the least complicated population estimator to use on wildlife enterprises. Thus, sightability models are the most useful and easily applied of the accurate methods for Monitoring population size, and should be the tool of choice for landowners in New mexico and similar MODELS Sightability models estimate population size by cor-recting the number of observed elk or deer groups by the Numbers missed due to incomplete detect-ability.
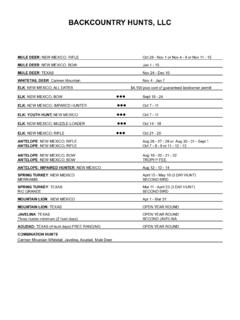
8 Detectability is never complete because some animals are obscured by shadow, in vegeta-tion, or otherwise hidden from view (Figure 3), and are thus missed during survey flights (Samuel et al., 1987). Many factors have been shown to af-fect detectability (Figures 4A and 4B), most com-monly group size, activity (whether individuals are bedded, standing, moving), amount and type of vegetative cover, topography, and presence or absence of snow cover (Caughley, 1974; Otten et al., 1993; Unsworth et al., 1994; Anderson et al.)
9 , 1998; Cogan and Diefenbach, 1998). Sightability models develop correction factors for variables that significantly influence detectability for a particular species in a particular habitat (Samuel et al., 1987; Unsworth et al., 1994). Most commonly, small groups of elk or deer are missed. This is important because herd composition ratios ( , number of young/100 adult females, number of bulls or bucks per 100 adult females, and age structure of bulls and bucks, particularly percent yearlings) are frequently used more for, and are often more important to, management of deer and elk populations than are the actual population estimates (Figures 5 and 6) (Bender, 2006, 2011).
10 Because these smaller, missed groups are most often bucks or bulls, it is especially important to correct for these to understand what the actual population sex and age structures are, what actual productivity is, and thus what and how much managers can har-vest to meet their goals ( , maximum sustained yields, trophy production, etc.).Sightability models for elk and mule deer have been developed specifically for New mexico habi-tats (L. Bender, unpublished data). Detectability of mule deer and elk during helicopter surveys in Circular 664 Page 3 Figures 4A and 4B.