Transcription of Health and Safety in Construction sector in Great …
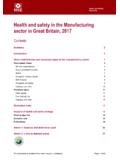
1 This document is available from Page 1 of 20 Health and Safety Executive Health and Safety statistics for the Construction sector in Great Britain, 2017 Contents Summary 2 Introduction 3 Work-related ill Health and workplace injury in Construction 4 Work-related ill Health 4 Overall scale 4 Musculoskeletal disorders and Stress, depression or anxiety 5 Other work-related ill Health conditions 7 Changes over time 10 Workplace Injury 11 Fatal injuries 11 Non-fatal injuries 12 Changes over time 14 Workplace risks 15 Impact of Health and Safety failings 16 Working days lost 16 Estimated cost to society 16 Enforcement 17 Annex 1: Sources and definitions used 18 This document is available from Page 2 of 20 Summary This document can be found at: 80,000 workers suffering from work -related ill Health each year.
2 (LFS) 30 fatal injuries to workers in 2016/17 (RIDDOR) 64,000 non-fatal injuries to workers each year (LFS) Work-related ill Health by illness type (Source: LFS annual average estimate 2014/15-2016/17) Fatal injuries to workers by most common accident kind (Source: Fatal injuries reportable under RIDDOR, 2012/13-2016/17 Non-fatal injuries to employees by most common accident kind (Source: Non-fatal injuries reported under RIDDOR 2014/15-2016/17) Note: LFS: Labour Force Survey RIDDOR: Reporting of Injuries Diseases and Dangerous Occurrences Regulations The most common accident kinds included in the charts above are those that account for 10% or more of injuries This document is available from Page 3 of 20 Introduction This report provides a profile of workplace Health and Safety in construction1.)
3 Construction includes three broad industry groups: Construction of buildings general Construction of buildings, including new work, repair, additions and alterations; Civil engineering Civil engineering work, including road and railway Construction , and utility projects; and Specialised Construction activities covering trades that are usually specialised in one aspect common to different structures. For example: demolition, electrical and plumbing installation, joinery installation, plastering, painting and glazing. There is an overlap between these groups, for example roofing work may be carried out by a specialist contractor and so included in Specialised Construction activities or by a general contractor as part of Construction of buildings.
4 This is important when reviewing the detailed breakdowns provided in this report and the tables on the HSE website. The Construction industry is a major employer accounting for around 7% of the UK workforce2. About 42% of the Construction workforce are self-employed. This report considers current Health and Safety in the sector , focusing on: 1. The scale and profile of work-related ill Health and injury in workers. A range of data sources is considered to allow a full assessment of the current Health and Safety situation. The preferred data source for both work-related ill Health and workplace injury is the Labour Force Survey, a large scale, nationally representative survey of households. This is supplemented with a range of data from other sources (eg for injuries, statutory notifications of workplace injuries under the Reporting of Injuries, Diseases and Dangerous Occurrence Regulations (RIDDOR)) to ensure as complete a picture as possible.
5 More details on the data sources used can be found at Annex 1. 2. The profile of workplace risks in the sector ; 3. The impact of Health and Safety failings in terms of working days lost, costs to society and enforcement action taken against employers within the sector . 1 The Construction sector is defined by section F within the 2007 Standard Industrial Classification. See for more detail. 2 Office for National Statistics estimate This document is available from Page 4 of 20 Work-related ill Health and workplace injury in Construction Work-related ill Health Overall scale Figure 1: Estimated annual number of cases of self-reported work-related ill Health in Construction by: (i) Illness kind (ii) Detailed industry grouping (Estimated annual number of cases) Source: Labour Force Survey, 2014/15-2016/17 Between 2014/15 and 2016/17: Each year around 80,000 Construction workers in GB suffer from an illness they believe was caused or made worse by their work.
6 Around 40% of these cases were new conditions, which started during the year, while the remainder were long-standing conditions. Of these 80,000 cases: 52,000 were cases of musculoskeletal disorders (MSD), of which just under a third were new conditions; 12,000 were cases of stress, depression or anxiety, of which around 60% were new conditions; 16,000 were cases of other illness (such as skin or respiratory conditions). Or by the different divisions of Construction : 26,000 (32%) were to workers in Construction of buildings 47,000 (59%) were to workers in Specialised Construction activities; and 7,000 (9%) were to workers in Civil engineering. Figure 2: Prevalence rate of self-reported work-related illness (per 100,000 workers) for: (i) Construction Source: Labour Force Survey, 2014/15-2016/17 Each year, between 2014/15 and 2016/17, around of workers in Construction in GB suffered from an illness that they believed was caused or made worse by their work in the sector .
7 This proportion is not significantly different to the rate for workers across all industries ( ). This document is available from Page 5 of 20 (ii) Skilled Construction and building trade workers Source: Labour Force Survey, 2014/15-2016/17 Within Construction , there is a broad range of jobs, some more hazardous than others. Some groups of these workers are more likely to be at risk of work-related ill Health . The occupation group Skilled Construction and building trades3 is an example. Each year, between 2014/15 and 2016/17, around of workers in this occupational group suffer from an illness that they believe was caused or made worse by their work in the sector . This proportion is statistically significantly higher than that for workers across all occupations ( ).
8 Figure 3: New cases of work-related ill Health in Construction sector workers seen by GPs Source: THOR GP, 2012-2014 Data from a GP reporting scheme of new cases of occupational ill Health presenting at GP surgeries (THOR4-GP) provides an alternative source of intelligence on work-related ill Health . Like the Labour Force Survey, this data provides intelligence on a broad range of conditions, although the severity threshold is generally greater since medical intervention has been sought. Data from the GP reporting scheme, while capturing a different severity range of ill Health cases to the LFS, suggests the rate of work-related illness in the Construction sector to be slightly higher than that seen across all industries.
9 Musculoskeletal disorders and Stress, depression or anxiety On average, stress and musculoskeletal disorders account for around 80% of the work-related ill Health cases in the Construction sector (Source: Labour Force Survey). Looking at how the Construction sector compares to all industries for both these illness types: Figure 4: Prevalence rate of self-reported work-related musculoskeletal disorders (per 100,000 workers) in: (i) Construction Source: Labour Force Survey, 2011/12, 2013/14-2016/17 Each year around of workers in the sector suffer from a musculoskeletal disorder they believe was work-related. This rate is statistically significantly higher than the rate across all industries ( ) This rate is highest in Specialised Construction activities ( ).
10 3 Occupations are defined using the 2010 Standard Occupational Classification. For more detail see 4 THOR The Health and Occupation Reporting network see Annex 1 This document is available from Page 6 of 20 (ii) Skilled Construction and building trade workers Source: Labour Force Survey, 2014/15-2016/17 For workers in Skilled Construction and building trade occupations the rate of work-related musculoskeletal disorders is more than double that seen in workers across all occupations (3% compared with for all occupations). Figure 5: New cases of work-related musculoskeletal disorders (MSD) in Construction sector workers seen by GPs Source: THOR GP, 2012-2014 Data from the GP reporting scheme suggests the rate of work-related musculoskeletal disorder in the Construction sector to be almost twice the rate across all industries, broadly confirming the findings from the Labour Force Survey of an elevated risk in this sector .