Transcription of Health at a Glance 2015 How does Australia compare?
1 Health at a Glance 2015 How does Australia compare? KEY FINDINGS Australia performs well in terms of overall population Health status. At years, life expectancy is the sixth highest in the OECD, and the country s record on breast and colorectal cancer survival is among the best. Australia has one of the lowest rates of tobacco consumption ( of the population aged 15 and over), but it is the fifth most obese country in the OECD ( of the population aged 15 and over). Australia achieves good outcomes relatively efficiently. Health expenditure is of GDP, about the same as the OECD average of There are areas where Australia can improve. It has high rates of hospital admission for chronic conditions that can be managed in primary care. Australian consumption of antidepressants, cholesterol-lowering drugs and antibiotics are among the highest in the OECD. Australians spend more on out-of-pocket Health care costs than the OECD average.
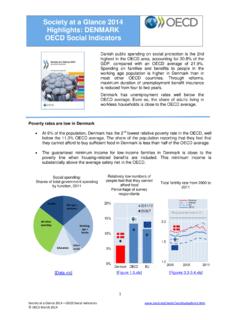
2 Australia s high rates of hospital admission for chronic conditions point to the need to strengthen primary Health care Potentially avoidable hospitalisations for asthma and chronic obstructive pulmonary disease (COPD) in Australia are among the highest in the OECD. Effective treatment for these conditions can be delivered at a primary-care level, negating the need for hospital admissions that are not in the best interests of patients and are more costly for the Health system. A well-organised primary Health care system emphasises Health promotion and prevention, and educating patients about self-management of chronic disease. In Australia , the age-sex standardised rate for asthma hospital admission is per 100 000 population, compared with the OECD average of per 100 000 population. For COPD, Australia s age-sex standardised rate for hospital admission is per 100 000 population, considerably higher than the OECD average of per 100 000 population.
3 Australia fares better with diabetes hospital admissions. The age-sex standardised rate is per 100 000 population, lower than the OECD average of per 100 000 population. Asthma and COPD hospital admission in adults, 2013 (or nearest year) Note: Three-year average for Iceland and Luxembourg. Source: OECD Health Statistics 2015 , Australian consumption of antidepressants and cholesterol-lowering drugs is among the highest in the OECD Australian consumption of antidepressants is the second highest in the OECD, and their use has grown considerably. There is wide variation in antidepressant use across countries, reflecting differences in the prevalence of depression, how it is diagnosed and treated, and physician prescribing behaviour. The defined daily dose (DDD the assumed average maintenance dose per day for a drug used for its main indication) in adults more than doubled in Australia , from 45 per 1 000 people per day in 2000 to 96 DDD per 1 000 people per day in 2013.
4 During the same period, the OECD average rose more modestly from 31 to 58 DDD per 1 000 people per day. In countries where antidepressant use is low, this may reflect unmet need. In countries like Australia where consumption is high, there is a need to assess the appropriateness of prescribing patterns, and the availability of alternative non-pharmaceutical treatments. Consumption of cholesterol-lowering drugs in Australia is the third highest in the OECD. Australian consumption more than tripled from 42 DDD per 1 000 people per day in 2000, to 134 DDD per 1 000 people per day in 2013. While this reflects an OECD-wide trend, Australia s use is still substantially higher than the OECD average of 95 DDD per 1 000 people per day. The rising use of these pharmaceuticals in Australia could be partially explained by a growing prevalence of obesity, which is associated with an increased risk of high cholesterol.
5 Internationally, prescription clinical guidelines for anti-cholesterol treatments have been updated several times since the 1990s and recommend wider screening, earlier treatment and higher dosages. This may also explain the rise in use across OECD countries. Australians are also large consumers of antibiotics The overuse and misuse of antibiotics can accelerate the emergence of drug-resistant strains, so that a drug that was previously effective to treat a particular microorganism is rendered ineffective. Therefore, antibiotics should be prescribed only where there is an evidence-based need. The overall volume of antibiotics prescribed in Australia is DDDs per 1 000 people per day, higher than the OECD average of DDDs per 1 000 people per day. In May 2015 , the World Health Assembly endorsed a global action plan to tackle antimicrobial resistance ( ). Antidepressant drugs consumption, 2000 and 2013 (or nearest year)Source: OECD Health Statistics 2015 , RepublicIsraelItalyNetherlandsGreeceCzec h RepublicFranceGermanySloveniaLuxembourgN orwayOECD28 AustriaSpainFinlandBelgiumNew ZealandDenmarkUnited KingdomSwedenCanadaPortugalAustraliaIcel andDef ined daily dose, per 1 000 people per day20002013118 Cholesterol-lowering drugs consumption, 2000 and 2013 (or nearest year)Source: OECD Health Statistics 2015 , RepublicHungaryIsraelSloveniaNetherlands LuxembourgNorwayDenmarkBelgiumAustraliaU nited KingdomSlovak RepublicDef ined daily dose, per 1 000 people per day20002013 Out-of-pocket Health care costs comprise a considerable portion of Health spending in Australia , compared with other OECD countries Out-of-pocket costs account for 20% of expenditure on Health care in Australia , slightly higher than the OECD average of 19%.
6 By contrast, out-of-pocket costs account for only 10% of Health spending in the United Kingdom, 13% in New Zealand and 14% in Canada, which have similar government-funded Health systems. Out-of-pocket costs also comprise a low proportion of Health spending in France (7%), whose Health system is largely funded by social security. The share of Health expenditure made up by out-of-pocket costs increased in Australia by 1% between 2008 and 2012. Expenditure on Health by type of financing, 2013 (or nearest year) 1. The Netherlands reports compulsory cost-sharing in Health care insurance and in Exceptional Medical Expenses Act under social security rather than under private out-of-pocket, resulting in an underestimation of the out-of-pocket share. 2. Data refer to total Health expenditure (= current Health expenditure plus capital formation). 3. Social security reported together with general government.
7 Source: OECD Health Statistics 2015 , The Australian economy has performed relatively well during the prevailing global financial conditions. Contrary to many OECD countries, Health expenditure has continued to grow in Australia during this period. The annual average growth rate in per capita Health expenditure in real terms in Australia was between 2005 and 2009, and fell slightly to 2% between 2009 and 2013. By contrast, Health spending growth ground to a halt across the OECD in the wake of the global financial and economic crisis. Between 2009 and 2013, average annual Health spending growth across the OECD was , compared with in the period between 2005 and 2009. With a tightening economic outlook and sustained Health expenditure growth pressures, OECD countries are considering policy measures to help underpin the financial sustainability of their Health care systems. For example, some countries have increased the level of co-payments in recent years.
8 Co-payments remain a blunt policy instrument that can have many unintended consequences, particularly when the prevailing economic conditions are simultaneously reducing incomes for many citizens. The risk remains that citizens forego needed care that can have long-term adverse Health outcomes. Given the current level of out-of-pocket payments in Australia , there is a need to ensure that policy options aimed at improving the appropriate use of care do not unduly affect the most vulnerable and the overall burden of out-of-pocket payment in the community more generally. Health at a Glance 2015 provides international comparisons of Health status, risk factors to Health , Health expenditure, access to care and quality of care. For the first time in 2015 , the publication also includes a set of dashboard indicators summarising the comparative performance of OECD countries on these different dimensions of population Health status and Health system performance.
9 More information on Health at a Glance 2015 is available at: For more information on OECD's work on Australia , please visit