Transcription of Health inequalities and women – addressing unmet needs
1 British Medical inequalities and women addressing unmet needsDr Jessica Allen Deputy director, UCL Institute of Health EquityDr Flavia Sesti Civil servant, Italian National Institute for Health , Migration and Poverty (NIHMP)1 British Medical AssociationHealth inequalities and women addressing unmet needsHealth inequalities and women addressing unmet needsDr Jessica Allen, Deputy director, UCL Institute of Health EquityDr Flavia Sesti, Civil servant, Italian National Institute for Health , Migration and Poverty (NIHMP)Key messages: There are clear and stark inequalities in Health between women , which are related to socio-economic status, ethnicity and geographic region. Across different stages of women s lives there are different social and economic factors which drive Health and associated Health inequalities ; including experiences during early childhood, education, family building and working life and through retirement and into older age.
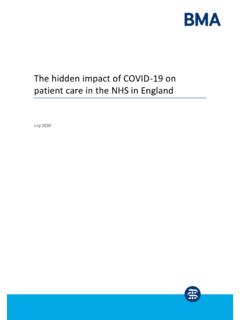
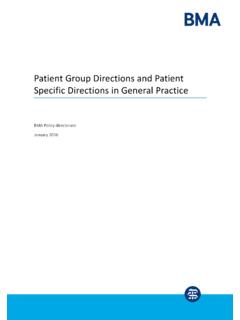
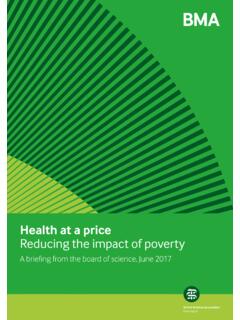
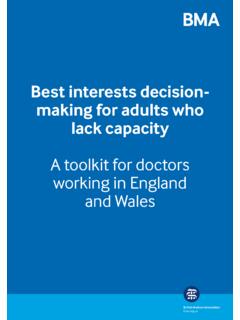
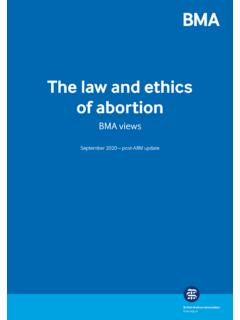
2 The broad Health workforce must take full account of the social and economic factors which shape women s lives and Health at different stages of There are marked and persistent Health inequalities across the United Kingdom (UK) in both length of life and in length of healthy life, for both men and women . These inequalities are closely related to socio-economic Figures 1 and 2 show life expectancy and disability free life expectancy related to level of neighbourhood deprivation. Each dot on the graphs is a neighbourhood in England. It is clear that inequalities in life expectancy and healthy life expectancy impact on everyone below the highest socio-economic status, not just the most deprived. The social gradient in Health is shown for men in figure 1 and women in figure 2, both of which clearly show gradients in disability free life expectancy and life expectancy related to levels of deprivation in neighbourhoods. Figure 1. Life expectancy and disability free life expectancy, males, based on 2011 Census2 British Medical AssociationHealth inequalities and women addressing unmet needsFigure 2.
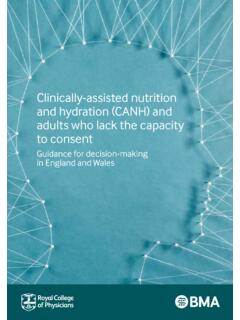
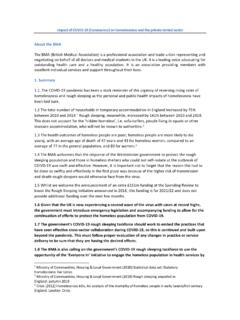
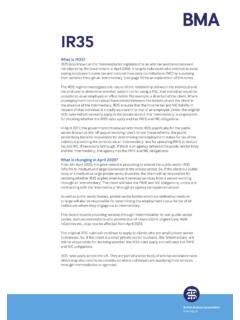
3 Life expectancy and disability free life expectancy, females, based on the 2 011 C e nsusThere have been several major global reviews of evidence,2,3 which describe close relationships between social, economic, environmental, cultural and political factors and Health outcomes known as the social determinants of Health . There is now widespread and increasing recognition that most inequalities in Health are caused by inequalities in the conditions in which people are born, grow, live, work and age. Local authority data show that for both men and women there are inequalities in Health within, as well as, between local authorities4 As Figure 3 shows, between local authorities there is a female life expectancy difference of seven years ranging from 79 years in Manchester to 86 in Kensington and Chelsea. Figure 3. Female life expectancy at birth and healthy life expectancy by local authority, 2013 -2015 3 British Medical AssociationHealth inequalities and women addressing unmet needsMoreover, within local authorities there is a significant inequality in life expectancy for women , based on level of neighbourhood deprivation.
4 This ranges from less than two years in Islington to 12 years or more in Stockton on Tees and Middlesbrough. European countries are experiencing an ageing population, and the UK has seen dramatic increases in life expectancy, with a longer life expectancy for both men and women . However, the trend now seems to be changing, raising new challenges in terms of policies and healthcare with life expectancy in England stalling and declining for women in some To improve Health and tackle Health inequities effectively and at the necessary scale, the role of policy makers, Health professionals and practitioners in other sectors (education, early years, work for instance) is fundamental. A discussion of the evidenceAt European level, even though life expectancy is increasing, it has registered a slowdown in the rate of increase in all countries since the global financial crisis, with the United Kingdom showing one of the worst trends. Compared to other countries, in the United Kingdom the increase in life expectancy from 2011 to 2015 was the slowest in Europe.
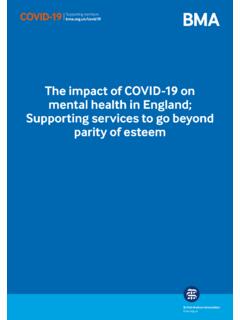
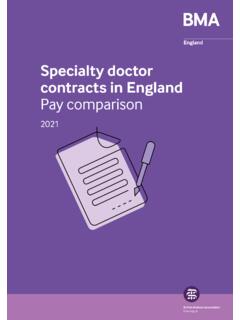
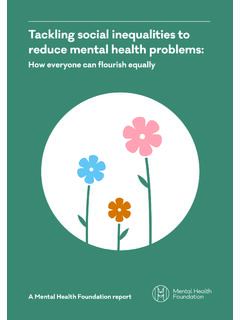
5 For women there was no increase the lowest in Europe and there was second slowest increase among men ( ).6 As shown in Figure 4 this trend is confirmed by the recent Marmot indicators in England, which show that the improvements in life expectancy at birth have In particular, looking at the period 2000-2015 the trend for women is worse than that of men: female life expectancy increased by one year every five years, while for men the increase was one year every three and a half years. Taking the period since 2010, the trend for women shows further deterioration: life expectancy at birth for women rose one year every 10 years while for men the figure was one year every six years. For female life expectancy at age 65 in England, life expectancy increased one year every six years, compared to one year every five years for men in the period 2000-2015. Moreover, from 2010 to 2015 life expectancy at age 65 slowed to a one year increase every 16 years for women and every nine years for 4.
6 Life expectancy at birth, England, 2009-20154 British Medical AssociationHealth inequalities and women addressing unmet needsLeaving aside specific biological factors, such as reproduction, men and women also tend to have differing experiences of social determinants across life shaped partly by gender roles the socially constructed characteristics of women and men, such as the norms and relationships which exist between the average age of death: three-quarters of female deaths are at age 75 and over, with two-thirds of these occurring at ages 85 and over. In contrast, for men three-fifths of deaths are at ages 75 and over, half of which are at ages 85 and For disability-free life expectancy (DFLE) which estimates the average number of years an individual is expected to spend free from a limiting long-term illness or disability, in England from 2012 to 2014 females at birth could expect to spend a lesser proportion ( ) of their lives free from disability compared with males ( ).
7 10 Moreover, the inequalities in DFLE across upper tier local authorities is wider for females ( years) than males ( years).The leading cause of death for women aged 80 and over is dementia and Alzheimer disease (37,252 deaths) and for men aged 85 and over (12,248 deaths). Since 2002 the rates of dementia and Alzheimer among women aged 85 and over have been rising. In particular, from 2002 to 2015 there was an increase of around 175% in dementia as the cause of death in women aged 85, as shown in Figure 5. Deaths due to dementia, females by single years of age, England and Wales, 2002-2015 For both men and women , lower socioeconomic groups have a higher incidence of poor mental Health and are more likely to have earlier onset of dementia compared to the higher socioeconomic groups. women represent two thirds of all people with dementia, with higher dementia prevalence rates than men ( for males and for females).12 women are more likely than men to experience the death of their partner, move into residential care and experience physical ill Health and poor mental Health and cognitive decline.
8 Depression can be a risk indicator for converting cognitive impairment to dementia and women have higher rates of depression than suggests that women with dementia have fewer visits to the GP, receive less Health monitoring and take more potentially harmful medication than men with dementia. Furthermore, women were found to be at particular risk of staying on antipsychotic or sedative medication for longer, probably due to the lower number of appointments where their treatment can be 5 British Medical AssociationHealth inequalities and women addressing unmet needsA study of socioeconomic position as a risk factor for death due to dementia showed that in women there is an association between leaving full-time education at a younger age and dementia-related death, which is not evident in Research found a positive association between poverty measures and common mental ,17 For example, in England, Wales, and Scotland it has been shown that some forms of mental disorder are correlated with levels of debt the individual As shown in Figure 6.
9 In women the pattern of social distribution of common mental disorders follows the social class gradient more markedly than women have a higher percentage of mental disorders than men in each income bracket 6. Prevalence of any common mental disorder by household income, England 2007 (Re-used with the permission of the Health and Social Care Information Centre. All rights reserved)Additionally, there are wider factors that may influence gender differences in Health in older age: women live longer than men and with more limiting illnesses which affects their ability to continue in employment, and women have higher rates of poverty in old age than male pensioners. Single retired women have higher risk of poverty than married retired women have on average only 57% of men s income with fewer women (60%) having pensions compared to men (80%).21 Moreover, a 2016 study found that, at age 60 64 a third of women , compared with half of men, continued to work part-time after the state retirement age and the employment rates further declined with age, with a gap between men and women , for whom just 5% continued to work between the ages of 70 and 74 compared with 10% of men at the same There are also clear inequalities in Health between migrant women and the host population.
10 Migrants are of the UK population and they contributed to more than half of the increase in the UK population between 1991 and 2014,23 being younger24 and with a higher fertility rate than native analysis of migrant Health for people aged 60 years and more reveals that there are no significant differences among UK and non-UK born men. In contrast, non-UK-born older women , who have spent between 10 and 39 years in the UK, have 71% higher odds than UK-born women of reporting that Health is limiting their typical As shown in Table 1, non-UK-born women have a slightly higher rate of maternal mortality (MM rate of ) than UK born ( ) women , the figure is even worse when analysing the specific country of origin. In this case, women born in certain countries have a significantly higher risk of death compared to UK-born women . For Jamaicans, for example, the relative risk (RR) compared with UK-born women (RR=1) is and for Nigerians or Pakistanis the relative risk is respectively and Looking at the same phenomenon in terms of UK born ethnic minority groups, Black and Asian groups RR is and compared with Whites (RR=1).