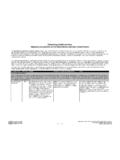
Transcription of Health Spending by Type of Service or Product
1 National Health Expenditures 2017 Highlights Health care Spending increased percent to reach $ trillion, or $10,739 per person in 2017. Health care Spending growth in 2017 was similar to average growth from 2008 to 2013, which preceded the faster growth experienced during the 2014-15 period that was marked by insurance coverage expansion and high rates of growth in retail prescription drug Spending . The overall share of gross domestic Product (GDP) related to Health care Spending was percent in 2017, similar to that in 2016 ( percent). Health Spending by Type of Service or Product : Hospital Care (33 percent share): Spending for hospital care increased percent to $ trillion in 2017, which was slower than the percent growth in 2016.
2 The slower growth in 2017 was driven by slower growth in the use and intensity of services. Hospital care expenditures slowed among the major payers private Health insurance, Medicare, and Medicaid. Physician and Clinical Services (20 percent share): Spending on physician and clinical services increased percent to $ billion in 2017. Growth for physician and clinical services slowed in 2017 and was driven by growth in non-price factors such as use and intensity of services. Although slowing, growth in clinical services continued to outpace the growth in physician services in 2017. Retail Prescription Drugs (10 percent share): Growth in retail prescription drug Spending slowed in 2017, increasing percent to $ billion.
3 The slower growth in 2017 followed percent growth in 2016, and was the lowest growth in retail prescription drug Spending since 2012, when several blockbuster drugs lost patent protection. The key drivers of the slower growth were a continued shift to lower-cost generic drugs and slower growth in the sales volume of some high-cost drugs. Other Health , Residential, and Personal Care Services (5 percent share): Spending for other Health , residential, and personal care services grew percent in 2017 to $ billion after increasing percent in 2016. The slight acceleration was driven by faster growth in residential mental Health and substance abuse facilities and ambulance services. This category includes expenditures for medical services that are generally delivered by providers in non-traditional settings such as schools, community centers, and the workplace; as well as by ambulance providers and residential mental Health and substance abuse facilities.
4 Nursing Care Facilities and Continuing Care Retirement Communities (5 percent share): Growth in Spending for freestanding nursing care facilities and continuing care retirement communities decelerated in 2017, growing percent to $ billion compared to percent growth in 2016. The slower growth in 2017 is largely attributable to slower Spending growth in both out-of-pocket and private Health insurance Spending . Dental Services (4 percent share): Spending for dental services increased percent in 2017 to $ billion, decelerating from percent growth in 2016. Private Health insurance (which accounted for 45 percent of dental Spending ) increased percent in 2017 a slowdown from growth of percent in 2016. Out-of-pocket Spending for dental services (which accounted for 41 percent of dental Spending ) also slowed, growing percent in 2017, after growth of percent in 2016.
5 Home Health Care (3 percent share): Spending for freestanding home Health care agencies increased percent in 2017, the same rate as 2016, to $ billion. Slower growth in Medicaid Spending and private Health insurance Spending was offset by faster Medicare Spending and out of pocket Spending . Medicare and Medicaid together made up 76 percent of home Health Spending in 2017. Other Professional Services (3 percent share): Spending for other professional services reached $ billion in 2017 and increased percent, a slower rate of growth compared to the increase of percent in 2016. Spending in this category includes establishments of independent Health practitioners (except physicians and dentists) that primarily provide services such as physical therapy, optometry, podiatry, or chiropractic medicine.
6 Other Non-durable Medical Products (2 percent share): Retail Spending for other non-durable medical products, such as over-the-counter medicines, medical instruments, and surgical dressings, grew percent (slower than the rate of growth in 2016 of percent) to $ billion in 2017. Durable Medical Equipment (2 percent share): Retail Spending for durable medical equipment, which includes items such as contact lenses, eyeglasses and hearing aids, reached $ billion in 2017 and increased percent, which was faster than the percent growth in 2016. The faster growth was driven by an acceleration in Medicare Spending as well as continued strong growth in private Health insurance and out of pocket Spending which account for almost 70 percent of total durable medical equipment Spending .
7 Health Spending by Major Sources of Funds: Private Health Insurance (34 percent share): Private Health insurance Spending increased percent to $ trillion in 2017, which was slower than percent growth in 2016. The deceleration was driven in part by slower growth in medical benefits and a decline in fees and taxes resulting from the Consolidated Appropriations Act of 2016, which suspended collection of the Health insurance plan fee in 2017. Medicare (20 percent share): Medicare Spending grew percent to $ billion in 2017, which was similar to the rate of growth in 2016 of percent. The growth in 2017 reflected slower growth in Spending for Medicare fee-for- Service ( percent in 2016 to percent in 2017) that was almost entirely offset by faster growth in Medicare Spending for private Health plans ( percent in 2016 to percent in 2017).
8 Medicaid (17 percent share): Total Medicaid Spending decelerated in 2017, increasing percent to $ billion compared to growth of percent in 2016. The slower growth in 2017 was influenced by slower growth in enrollment and a reduction in the Medicaid net cost of Health insurance. State and local Medicaid expenditures grew percent, while federal Medicaid expenditures increased percent in 2017. Out-of-Pocket (10 percent share): Out-of-pocket Spending grew percent in 2017 to $ billion, which was slower than percent growth in 2016. Health Spending by Type of Sponsor1: In 2017, the federal government and households accounted for the largest shares of Spending (at 28 percent each) followed by private businesses (20 percent), and state and local governments (17 percent).
9 Federal government Spending on Health slowed in 2017, increasing percent after percent growth in 2016. The deceleration was largely associated with slower federal Medicaid Spending . Despite the slower growth, the federal government s share of Health care Spending remained at 28 percent. Health Spending by households grew at a rate of percent, which was a deceleration from percent in 2016. The slower growth in 2017 was largely due to a deceleration in out-of-pocket Spending . Out-of-pocket expenditures, the largest category of household Spending (37 percent share), increased percent in 2017 compared to growth of percent in 2016. Despite the slower growth in 2017, households represented 28 of Health care Spending , a share that has remained unchanged since 2014.
10 Health care financed by state and local governments grew percent in 2017, an acceleration from percent growth in 2016. The faster growth was driven by increases in state and local Medicaid Spending , which represented 37 percent of state and local government Health Spending . State and local government s share of Health care Spending remained at 17 percent, a share that has been relatively stable since 2014. Spending on Health care by private businesses slowed in 2017, increasing percent compared to percent growth in 2016. The largest category of private business Health care costs are employer-sponsored premiums, which increased percent in 2017. The private business share of overall Health Spending remained fairly steady since 2010, at about 20 percent.