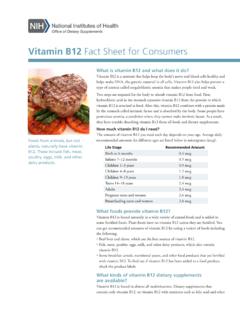
Transcription of Healthy weight, overweight, and obesity among U.S. adults
1 Healthy weight, overweight, and obesity among adults Healthy weight, overweight, and obesity Overweight and obesity are caused by many factors, including the contributions of inherited, metabolic, behavioral, environmental, cultural, and socioeconomic effects. Overweight and obesity may raise the risk of illness from high blood pressure, high blood cholesterol, heart disease, stroke, diabetes, certain types of cancer, arthritis, and breathing problems. As weight increases, so does the prevalence of health risks. The health outcomes related to these diseases, however, may be improved through weight loss or, at a minimum, no further weight gain. Because of the importance of these issues, the Department of Health and Human Services considers overweight and obesity among the 10 leading health indicators in Healthy People 2010, the health objectives for the Nation.
2 The potential benefits from reduction in overweight and obesity are of considerable public health importance. Defining Healthy weight, overweight, and obesity in adults Simple, health-oriented definitions of overweight and obesity should be based on the amount of excess body fat at which health risks to individuals begin to increase. No such definitions currently exist. Measurements of height and weight help to assess the overall health and nutritional status of adults . Overweight, obesity , and Healthy weight can be defined by the body Mass Index (BMI), calculated as weight in kilograms/height in meters squared. The BMI values corresponding to overweight, obesity , and Healthy weight are shown in table 1, along with the corresponding ranges of weight in pounds for men and women of average height.
3 In the United States, the average adult man has a BMI of and the average adult woman has a BMI of Although BMI is not a measure of body fatness, persons classified as obese, tend to have excess body fat. A BMI in the overweight range is less Healthy for most people, but in some cases may be acceptable for people who are muscular and have less fat. Similarly, people with a BMI in the Healthy weight range may have excess body fat and little muscle. Therefore, the BMI ranges are not exact ranges of Healthy and unhealthy weight. However, studies have shown that health risk increases as BMI increases. National data on Healthy weight, overweight, and obesity The most accurate national data on overweight and obesity come from heights and weights measured as part of the National Health and Nutrition Examination Survey (NHANES) and previous health examination surveys.
4 These surveys show the current prevalence of overweight and obesity and trends in overweight and obesity over time. Because the NHANES surveys have data on measured Table1. body mass index (BMI) values for Healthy weight, overweight, and obesity Corresponding weight in pounds (approximate) Man 5 9 tall Weight BMI values Woman 5 4 tall (average height)(average height) Healthyweight .. 121 163 108 144 Overweight .. 164 195 145 173 Obese .. 30 and above 196 and above 174 and above DEPARTMENT OF HEALTH AND HUMAN SERVICES Centers for Disease Control and Prevention National Center for Health Statistics weight and height from 1960 to 2000, information from these surveys can also be used to track trends over time.
5 Prevalence of Healthy weight, overweight, and obesity The prevalence of Healthy weight, overweight, and obesity are shown in table 2 by sex and race-ethnic group, based on data from NHANES III (1988 94). NHANES provides estimates for three major race-ethnic groups: non-Hispanic white, non-Hispanic black, and Mexican American, as well as for the total population including all race-ethnic groups. In the total population, the prevalence of Healthy weight was higher overall for women than for men, but within race-ethnic groups this was true only for non-Hispanic white women. The prevalence of overweight (BMI 25 ) was higher for men than for women, but the prevalence of obesity (BMI 30 or greater) was lower for men than for women.
6 The prevalence of overweight and obesity was lower for non-Hispanic white women than for non-Hispanic black or Mexican-American women. New data from 1999 2000 Comparisons of data from NHANES III with data from NHANES 1999 2000 for adults ages 20 years and over who are either overweight or obese (table 3) indicates that the percent of overweight and obese adults is continuing to increase. The percent of persons who are overweight or obese, with a BMI of or higher, increased from 56 percent in 1988 94 to 64 percent in 1999 2000. Trends from the 1960s to 2000 The percent of obese adults (BMI 30 or greater) increased over four decades from the 1960s to 2000 (figure 1), as the percentage of adults with Healthy weights declined (figure 2).
7 As shown in these figures: The percent of obese adults varied little from 1960 to 1980 but increased considerably between 1980 and 1991, from 13 to 21 percent among men and from 17 to 26 percent among women. This trend continued in 1999 2000, with an increase in obesity of 28 percent of men and 34 percent of women. The percent of adults with Healthy weights declined approximately 10 percent from 1960 to 1994, with an additional decline of approximately 8 percent from 1994 to 2000 (figure 2). For more information about NHANES please visit our Web site: Use the following formula to calculate BMI: BMI = weight (lbs.) height (in.) height (in.) 703 Table2. Percent of Healthy weight, overweight, and obese adults , ages 20 years and older, by sex and race-ethicgroup: United States, 1988 94 Healthy weight Overweight Obese Race-ethnic group (BMI ) (BMI ) (BMI 30 or above) Men.
8 Non-Hispanic white .. Non-Hispanic black .. Mexican Women .. Non-Hispanic white .. Non-Hispanic black .. Mexican Table3. Trends in percent of overweight and obese adults ages 20 years and above NHANES III NHANES Weight (1988 94) 1999 2000 Overweight or obese (BMI 25 or above).. 56 64 Overweight (BMI ) .. 33 34 Obese (BMI 30 or above) .. 23 30 Figure 1. Trends in obesity (BMI or above), age 20 74 years: United States Figure 2. Trends in Healthy weight (BMI ), ages 20 74 years: United States 03-0260 (7/03)