Transcription of Heteroskedasticity
1 Heteroskedasticity Richard Williams, University of Notre Dame, ~rwilliam/. Last revised January 30, 2015. These notes draw heavily from Berry and Feldman, and, to a lesser extent, Allison, and Pindyck and Rubinfeld.]. What Heteroskedasticity is. Recall that OLS makes the assumption that V ( j ) = 2 for all j. That is, the variance of the error term is constant. (Homoskedasticity). If the error terms do not have constant variance, they are said to be heteroskedastic. [Tidbit from Wikipedia: The term means differing variance and comes from the Greek hetero ('different'). and skedasis ('dispersion').]. When Heteroskedasticity might occur.
2 Errors may increase as the value of an IV increases. For example, consider a model in which annual family income is the IV and annual family expenditures on vacations is the DV. Families with low incomes will spend relatively little on vacations, and the variations in expenditures across such families will be small. But for families with large incomes, the amount of discretionary income will be higher. The mean amount spent on vacations will be higher, and there will also be greater variability among such families, resulting in Heteroskedasticity . Note that, in this example, a high family income is a necessary but not sufficient condition for large vacation expenditures.
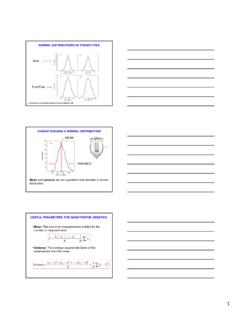
3 Any time a high value for an IV is a necessary but not sufficient condition for an observation to have a high value on a DV, Heteroskedasticity is likely. Similar examples: Error terms associated with very large firms might have larger variances than error terms associated with smaller firms. Sales of larger firms might be more volatile than sales of smaller firms. Errors may also increase as the values of an IV become more extreme in either direction, with attitudes that range from extremely negative to extremely positive. This will produce something that looks like an hourglass shape: Heteroskedasticity Page 1. 4. 2. 0. e1. -2.
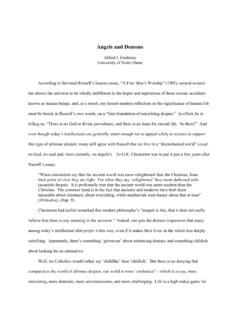
4 -4. -6. -2 -1 0 1 2. x Measurement error can cause Heteroskedasticity . Some respondents might provide more accurate responses than others. (Note that this problem arises from the violation of another assumption, that variables are measured without error.). Heteroskedasticity can also occur if there are subpopulation differences or other interaction effects ( the effect of income on expenditures differs for whites and blacks). (Again, the problem arises from violation of the assumption that no such differences exist or have already been incorporated into the model.) For example, in the following diagram suppose that Z stands for three different populations.
5 At low values of X, the regression lines for each population are very close to each other. As X gets bigger, the regression lines get further and further apart. This means that the residual values will also get further and further apart. Other model misspecifications can produce Heteroskedasticity . For example, it may be that instead of using Y, you should be using the log of Y. Instead of using X, maybe you should be using X2, or both X and X2. Important variables may be omitted from the model. If the model were correctly specified, you might find that the patterns of Heteroskedasticity disappeared. Consequences of Heteroskedasticity .
6 Note that Heteroskedasticity is often a by-product of other violations of assumptions. These violations have their own consequences which we will deal with elsewhere. For now, we'll assume that other assumptions except Heteroskedasticity have been met. Then, Heteroskedasticity does not result in biased parameter estimates. Heteroskedasticity Page 2. However, OLS estimates are no longer BLUE. That is, among all the unbiased estimators, OLS does not provide the estimate with the smallest variance. Depending on the nature of the Heteroskedasticity , significance tests can be too high or too low. As Allison puts it: The reason OLS is not optimal when Heteroskedasticity is present is that it gives equal weight to all observations when, in fact, observations with larger disturbance variance contain less information than observations with smaller disturbance variance.
7 In addition, the standard errors are biased when Heteroskedasticity is present. This in turn leads to bias in test statistics and confidence intervals. Fortunately, unless Heteroskedasticity is marked, significance tests are virtually unaffected, and thus OLS estimation can be used without concern of serious distortion. But, severe Heteroskedasticity can sometimes be a problem. Warning: Heteroskedasticity can be very problematic with methods besides OLS. For example, in logistic regression Heteroskedasticity can produce biased and misleading parameter estimates. I talk about such concerns in my categorical data analysis class.
8 Detecting Heteroskedasticity Visual Inspection. Do a visual inspection of residuals plotted against fitted values; or, plot the IV suspected to be correlated with the variance of the error term. In Stata, after running a regression, you could use the rvfplot (residuals versus fitted values) or rvpplot command (residual versus predictor plot, plot the residuals versus one of the X variables included in the equation). In SPSS, plots could be specified as part of the Regression command. In a large sample, you'll ideally see an envelope of even width when residuals are plotted against the IV. In a small sample, residuals will be somewhat larger near the mean of the distribution than at the extremes.
9 Thus, if it appears that residuals are roughly the same size for all values of X (or, with a small sample, slightly larger near the mean of X). it is generally safe to assume that Heteroskedasticity is not severe enough to warrant concern. If the plot of residuals shows some uneven envelope of residuals, so that the width of the envelope is considerably larger for some values of X than for others, a more formal test for Heteroskedasticity should be conducted. Breusch-Pagan / Cook-Weisberg Test for Heteroskedasticity . The Breusch-Pagan test is designed to detect any linear form of Heteroskedasticity . You run a regression, and then give the estat hettest command (or, hettest alone will work).
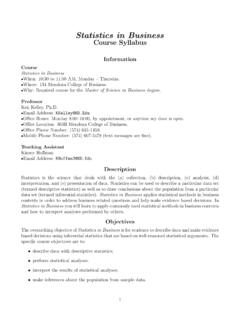
10 Using the reg01 data, Heteroskedasticity Page 3.. use ~rwilliam/ , clear . reg income educ jobexp Source | SS df MS Number of obs = 20. -------------+-------------------------- ---- F( 2, 17) = Model | 2 Prob > F = Residual | 17 R-squared = -------------+-------------------------- ---- Adj R-squared = Total | 19 Root MSE = ---------------------------------------- -------------------------------------- income | Coef. Std. Err. t P>|t| [95% Conf. Interval]. -------------+-------------------------- -------------------------------------- educ | .2099494 jobexp | .6493654 .1721589 .2861417 _cons | .5542051.