Transcription of HEX/12/07: Legionella outbreaks and HSE investigations; an ...
1 Harpur Hill, Buxton Derbyshire, SK17 9JN T: +44 (0)1298 218000 F: +44 (0)1298 218590 W: Legionella outbreaks and HSE investigations; an analysis of contributory factors HEX/12/07 Crown copyright (2012) CONTENTS PAGE 1. BACKGROUND AND DATA 1 Legionnaires disease outbreaks 1 HSE enforcement action taken on Legionella 1 2. 3 outbreak data 3 Notices data 4 Prosecutions data 5 3. ANNEXES 1 TO 3 .. 6 1. BACKGROUND AND DATA SOURCES Data are presented from two sources of information in this factual report, as described below. LEGIONNAIRES DISEASE outbreaks Health and Safety Laboratory (HSL), an agency of the Health and Safety Executive (HSE) was tasked by HSE s Legionella Committee in September 2011 to gather data on outbreaks of Legionnaires disease1 in Great Britain. This was done for the 10 year period to August 2011, to identify the relationship with a range of factors. outbreaks were defined as two or more cases following the Health Protection Agency (HPA) and Health Protection Scotland (HPS) guidelines see HPA and HPS Legionella web sites : Community clusters - two or more cases (ie an individual with infection) linked by area of residence or work, or places visited and sufficient proximity in dates of onset of illness to warrant further investigation ; Community outbreaks - community clusters for which there is strong epidemiological evidence of a common source of infection, with or without microbiological evidence, and in response to which control measures have been applied to suspected sources of infection.
2 The summary data in this report are presented according to: Industry Sector; Type of water system involved ( , industrial process waters, spa pools, hot & cold water systems); Number of cases (either clinically diagnosed or other; fatalities); Any failures in compliance with legislation identified during the investigation . A range of information sources was used (including HSE records, outbreak committee reports and press releases from HSE and others, Health Protection Agency and other disease reporting data and national and local news reports). Not all outbreaks originated from HSE enforced premises and not all investigations involved HSE. The review provides a broad, general picture of outbreaks in the last ten years rather than a definitive record of all outbreaks or actions taken. HSE ENFORCEMENT ACTION TAKEN ON Legionella Data were mined from HSE s record systems and included: 1 Also including Pontiac Fever (a less severe disease caused by Legionella bacteria) 1 Improvement and Prohibition Notices served by HSE on duty holders in relation to breaches of legislation on Legionella control (arising from proactive inspections and investigations); Prosecutions by HSE on duty holders in breach of legislation relating to control of Legionella (arising from investigations).
3 The data covers the 5 year period up to June 2012. These are presented for notices issued and prosecutions conducted, broken down similarly to the outbreak data, by: Industry Sector; Type of water system (cooling towers; other industrial process waters, hot & cold water systems); Failures in compliance ( , reason for notice or prosecution). The enforcement data relates purely to that taken by HSE arising from both proactive and reactive work. The data include some obtained during intervention programmes targeted at certain sectors, which has resulted in increased enforcement activity in that sector. Therefore, this should be taken into account when comparing levels of compliance between sectors on the basis of the information acquired. The findings are presented in Annex 1 for outbreak data, Annex 2 for Improvement and Prohibition notices and Annex 3 for Prosecutions. 2 2. RESULTS outbreak DATA Summary of data A total of 44 separate outbreaks from the 10 year period to August 2011 were used in the data summarised in Annex 1.
4 In Annexes 1 to 3, Public Services includes HSE enforced premises such as hospitals and nursing homes, while in Annex 1 Local Authorities enforced premises include residential homes, hotels and leisure facilities. For some of these there is limited information relating to the established source of contamination. This is reflected in the data sets under the heading not specified . Sector data and water system data are expressed as a proportion of the total number of outbreaks (n = 44). Because reasons for outbreaks (failings) were clearly identified only for 17 of the total number, these data are expressed as a proportion of those 17. In some instances more than one failing could be identified. The reason for failure Scheme of Control refers to the requirement under HSE legislation for duty holders to use their assessment of risk of exposure to Legionella bacteria to draw up and implement precautionary measures to control exposure and ensure that controls remain effective.
5 Comparing numbers of cases in Legionnaires disease outbreaks to water systems Where water systems attributable to outbreaks were identified, it was possible to compare the number of diagnosed cases of Legionnaires disease and Pontiac fever to water system type. Table 1 summarises data obtained from outbreaks . 3 Table 1. Cases of Legionnaires disease and Pontiac fever attributed to types of water system Type of water system Impact Cooling tower (n=7) Other industrial water systems (n=4) Hot & Cold water systems (n=11) Spa Pools (n=6) Not specified (n=16) Total (n=44) Cases of LD 1931 14 23 29 92 351 Fatalities 10 1 7 3 12 33 Cases of Pontiac fever 36 0 1402 2263 0 2624 Average number of cases of LD per outbreak Average number of cases of LD + Pontiac fever per outbreak LD = Legionnaires disease 1 Includes 146 cases of LD and 7 fatalities at Barrow.
6 27 cases of LD and 2 fatalities at Hereford. 2 All from a Dundee hotel; also counted against Spa Pools as both sources implicated. 3 Includes 78 cases at a North East England leisure club and 140 at Dundee. 4 Adjusted so as not to count twice the cases jointly associated with Hot & Cold and Spa pools. 5 Including cases of Pontiac fever at Dundee where both sources implicated NOTICES DATA HSE s records system was searched for references to Legionella for a 5 year period to June 2012. From the data obtained, cases not involving enforcement action against failings in Legionella control were discarded The search identified 321 separate cases, and these were classified into agreed categories of industry sector, water system type and failures of compliance (Annex 2). Where an individual case involved more than one water system type, or received improvement notices against more than one category of failure, these were classified as separate items, therefore increasing numbers of data points to n = 409 for water system types and n = 401 for failures in compliance.
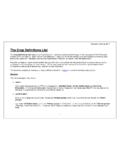
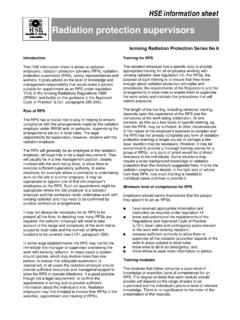
7 4 PROSECUTION DATA The search as described in also identified details of prosecutions brought by HSE against companies for failure of Legionella control. Because of the time taken for legal proceedings, the 5 year period to June 2012 necessarily included premises where actions by HSE had taken place earlier. The search identified 14 separate cases, and these were classified by HSL into agreed categories of industry sector, water system type and failure to comply (Annex 3). Because the reasons for prosecution often included more than one failure, combined data are presented as collective failings. 5 3. ANNEXES 1 TO 3 The following Annexes summarise the analysed data for Legionnaires disease outbreaks and HSE investigations. 6 outbreaks by Sector (n = 44)25%16%30%2%27%ManufacturingPublic ServicesLocal AuthoritiesWaste & RecyclingNot SpecifiedOutbreaks by Failing (n = 24 from 17 outbreaks )25%63%4%8%Risk AssessmentScheme of ControlCleaning & DisinfectionTraining and CompetenceOutbreaks by System Type (n = 44)Other Hot & Cold Water SystemSpa PoolsNot SpecifiedCooling Tower16%9%25%14%36%Annex 1: Summary of outbreak dataThe data used in this analysis were derived from a variety of sources.
8 Where reliable information on the source of the outbreak was available, the data was classified according to sector, water system type and by Sector (n = 44)25%16%30%2%27%ManufacturingPublic ServicesLocal AuthoritiesWaste & RecyclingNot SpecifiedOutbreaks by Sector (n = 44)25%16%30%2%27%ManufacturingPublic ServicesLocal AuthoritiesWaste & RecyclingNot SpecifiedOutbreaks by Failing (n = 24 from 17 outbreaks )25%63%4%8%Risk AssessmentScheme of ControlCleaning & DisinfectionTraining and CompetenceOutbreaks by Failing (n = 24 from 17 outbreaks )25%63%4%8%25%63%4%8%Risk AssessmentScheme of ControlCleaning & DisinfectionTraining and CompetenceRisk AssessmentScheme of ControlCleaning & DisinfectionTraining and CompetenceOutbreaks by System Type (n = 44)Other Hot & Cold Water SystemSpa PoolsNot SpecifiedCooling Tower16%9%25%14%36% outbreaks by System Type (n = 44)Other Hot & Cold Water SystemSpa PoolsNot SpecifiedOther Hot & Cold Water SystemSpa PoolsNot SpecifiedCooling Tower16%9%25%14%36%Annex 1: Summary of outbreak dataThe data used in this analysis were derived from a variety of sources.
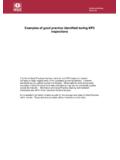
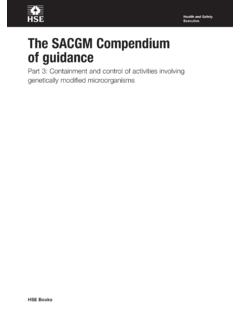
9 Where reliable information on the source of the outbreak was available, the data was classified according to sector, water system type and 2: The data used in this analysis was derived by HSE s Operational Information and Intelligence systems. Where an individual case involved more than one water system type, or received improvement notices against more than one category of failure, these were classified as separate Cases by Industry Sector (n=321)ManufacturingOffshoreChemicalsEle ctricity Public ServicesWaste & RecyclingLeisure31%59%4%1%5%34%1%2%1%60% 1%1%Enforcement Cases by Failing (n=401)Risk AssessmentScheme of ControlResponsible PersonCleaning & DisinfectionTraining & Competence33%63%2%1%1%Enforcement by System Type (n=409)Cooling TowerHot & Cold Water SystemOtherCooling Tower & Hot & Cold Water SystemCooling Tower & OtherAnnex 2: The data used in this analysis was derived by HSE s Operational Information and Intelligence systems. Where an individual case involved more than one water system type, or received improvement notices against more than one category of failure, these were classified as separate Cases by Industry Sector (n=321)ManufacturingOffshoreChemicalsEle ctricity Public ServicesWaste & RecyclingLeisure31%59%4%1%5%34%1%2%1%60% 1%1%Enforcement Cases by Failing (n=401)Risk AssessmentScheme of ControlResponsible PersonCleaning & DisinfectionTraining & Competence33%63%2%1%1%Enforcement by System Type (n=409)Cooling TowerHot & Cold Water SystemOtherCooling Tower & Hot & Cold Water SystemCooling Tower & OtherManufacturingOffshoreChemicalsElect ricity Public ServicesWaste & RecyclingLeisureManufacturingOffshoreChe micalsElectricity Public ServicesWaste & RecyclingLeisure31%59%4%1%5%34%1%2%1%60% 1%1%Enforcement Cases by Failing (n=401)
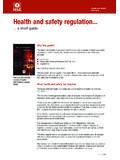
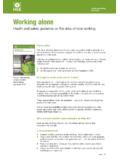
10 Risk AssessmentScheme of ControlResponsible PersonCleaning & DisinfectionTraining & CompetenceRisk AssessmentScheme of ControlResponsible PersonCleaning & DisinfectionTraining & CompetenceScheme of ControlResponsible PersonCleaning & DisinfectionTraining & Competence33%63%2%1%1%Enforcement by System Type (n=409)Cooling TowerHot & Cold Water SystemOtherCooling Tower & Hot & Cold Water SystemCooling Tower & Other33%63%2%1%1%Enforcement by System Type (n=409)Cooling TowerHot & Cold Water SystemOtherCooling Tower & Hot & Cold Water SystemCooling Tower & OtherCooling TowerHot & Cold Water SystemOtherCooling Tower & Hot & Cold Water SystemCooling Tower & Other 7 Prosecutions by System Type (n = 14)50%43%7%Cooling TowerHot & Cold Water SystemOtherAnnex 3: Summary of Prosecutions dataThe data used in this analysis was derived by HSE s Operational Information and Intelligence by Industry Sector (n = 14)50%36%7%7%ManufacturingPublic ServicesLeisureWaste & RecyclingProsecutions by Collective Failings (n=14)50%7%43%Scheme of ControlRisk Assessment & Scheme of ControlScheme of Control, Training & Competence Prosecutions by System Type (n = 14)50%43%7%50%43%7%Cooling TowerHot & Cold Water SystemOtherCooling TowerHot & Cold Water SystemOtherAnnex 3.