Transcription of Highlights - National Agricultural Statistics Service
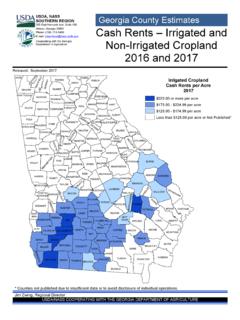
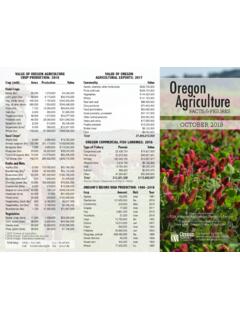
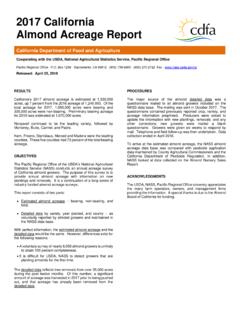
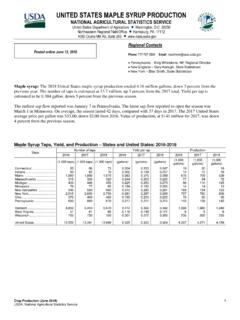
1 Highlights Farms and Farmland ACH12-13/September 2014. Numbers, Acreage, ownership , and Use Two fifths of all land .. In 2012, just over 40 percent of all land was farmland. The amount of land in farms essentially held steady between 2007, when the last agriculture .. in the United States is census was conducted, and 2012. In that same five-year period, however, the farmland. 915 million acres. number of farms Fig. 1. million farms and ranches. in the United Farmland as Percent of land Area, by County, 2012. States declined, and average farm size increased. Farmland = continued to be most heavily concentrated in the center of the country. (Fig. 1). percent < 10. 10 - 29. 30 - 49. 50 - 69. 70 - 89. 90 +. Source: USDA NASS, 2012 Census of Agriculture. Understanding the Numbers * = statistically signi cant change Farms and land The 2012 Census of Agriculture Fig. 2. contains a measure of relative The United Number of Farms, 1982 - 2012. reliability (the coefficient of variation) States had (millions).
2 For every data item published. This million farms Highlights document does not include in 2012. This these numbers, but shows through was 4 percent an asterisk (*) every number that is fewer than in a statistically significant change from 2007, continuing the 2007 Census to the 2012 Census a long-term (defined as two or more standard errors). decline in the number of To learn more about statistical farms. (Fig. 2). significance and census methodology, During the same go to the frequently asked questions at time, the amount 1982 1987 1992 1997 2002 2007 2012. of land in farms Source: USDA NASS, 2012 Census of Agriculture and earlier census data. United States Department of Agriculture National Agricultural Statistics Service (800)727-9540. 1. changed little, declining from 922 million acres in 2007 to 915 million acres in 2012 (or percent of land to land Use percent). The average size of farms in 2012 was 434 acres, 4 percent larger than five years earlier. (Table 1) Of the 915 million acres of land in farms in 2012, per- Median farm size (that is, the point at which half the farms cent was permanent pasture, percent was cropland, are larger and half are smaller) remained unchanged, at 80 and percent was woodland.
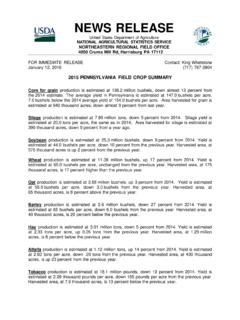
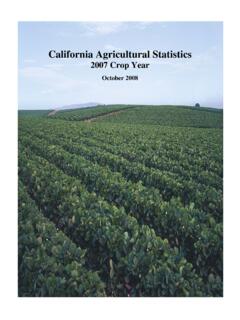
3 The remaining per- acres. cent was land in farmsteads, buildings, livestock facilities, etc. Although the amount of cropland overall was down 4. percent,the amount of cropland harvested was nearly 2. Table 1 percent more in 2012 than 2007. (Table 2). Farms and Farmland, 2007 and 2012 % Table 2. 2007 2012 change Farmland by Use, 2007 and 2012. Number of farms 2,204,792 2,109,303 *. 2007 2012 %. Farmland (acres) 922,095,840 914,527,657 * (millions of acres) change Average farm size (acres) 418 434 + * Total *. Source: USDA NASS, 2012 Census of Agriculture. Permanent pasture + *. Cropland *. of which harvested + *. Between 2007 and 2012, the number of farms decreased Woodland + *. in all size categories except the largest. Just over two Other land + *. thirds of farms had fewer than 180 acres in 2012, but the 4. Source: USDA NASS, 2012 Census of Agriculture. percent of farms with 2,000 or more acres made up more than half (55 percent) of all farmland. (Fig. 3) Farm size varied by state; the average size of farms and ranches in For the first time, corn grown for grain and soybeans to- the West was larger than for the United States overall.
4 Gether accounted for more than 50 percent of all cropland harvested ( million acres). Of the principal crops har- Fig. 3 vested, soybeans (up 19 percent) and corn for silage (up Share of Farms and Farmland, by Farm Size, 2012 20 percent) had the largest percentage increases in acres (as percent of total) from 2007 to 2012. Corn for grain and land in orchards also increased, while fewer acres were devoted to other crops 55%. such as forage, cotton, and vegetables. (Table 3). 2,000 acres or more 4%. Table 3. 1,000 to 1,999 acres 14% Principal Crops Harvested, 2007 and 2012. 4%. (millions of acres). 500 to 999 acres 11% %. 7% 2007 2012. change Corn for grain +1*. Farm Size 11%. 180 to 499 acres Soybeans +19*. 16%. Forage -9*. 50 to 179 acres 7% Winter wheat -3*. 30% Spring wheat -6*. Cotton -11*. 2%. 10 to 49 acres 28%. Corn for silage +20*. Orchard crops +3*. 0% Sorghum for grain -24*. 1 to 9 acres Farmland 11% Vegetables -4*. Farms Barley -7*. Source: USDA NASS, 2012 Census of Agriculture.
5 Rice -2*. Durum wheat 0*. Sunflower seed -6*. Source: USDA NASS, 2012 Census of Agriculture. 2 Farm and Farmland It is also useful to look at changes in the number of farms by the commodities they specialize in. The number of farms land ownership specializing in horses, corn, soybeans, sheep and goats, vegetables, and wheat all increased. Poultry and egg farms The principal farm operator is the person making the day- and hog and pig farms showed the sharpest declines in to-day decisions for the farm or ranch operation, whether number of farms. Beef cattle farming and ranching is the the person owns or rents the land they operate. Operators largest farm sector in value of sales and number of farms; can be full owners (own all the land they farm), part own- more than 600,000 farms received most of their income ers (rent some farmland but own some as well), or tenants in 2012 from producing cattle and calves. But the number (rent all the land they farm). Only 25 percent of principal of such operations declined 6 percent between 2007 and operators were part owners of their farms in 2012, but they 2012.
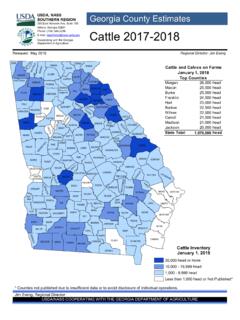
6 (Fig. 4) controlled more than 50 percent of all farmland. Theirs were the largest farms, in terms of both acres operated and Fig. 4 the value of agriculture sales. (Table 4). Farms by Commodity Specialization, Selected Commodities, 2007 and 2012. (thousands of farms) Table 4. Farm ownership , 2012. Beef cattle* (principal operator). % of % of Average Size Farms Farmland (acres) (dollars). Hay Full owners 235 $98,984. Part owners 922 $393,577. Horses Tenants 588 $293,858. Source: USDA NASS, 2012 Census of Agriculture. Corn Fruits and Nearly 40 percent of all farmland was rented/leased, but tree nuts the proportion varied across the country. The Mississippi Delta region and the corn and soybean growing areas of Soybeans* the Midwest are among the places with high percentages of rented land . (Fig. 5). The states with the largest propor- tion of farmland rented from others are Alaska (76 percent), Sheep and goats Illinois (60 percent), Delaware ( percent), Indiana ( Greenhouse percent), and Iowa ( ).
7 And nursery Poultry and Fig. 5. eggs* Percent of Farmland Rented or Leased, by County, 2012. Dairy cattle 2012. and milk* 2007. = Vegetables Wheat*. Hogs*. percent < 20. Cattle feedlots*. 20 - 29. 30 - 39. Commodity specialization means more than half of a farm's sales came from that commodity. 40 - 49. Source: USDA NASS, 2012 Census of Agriculture. 50 - 59. 60 +. Source: USDA NASS, 2012 Census of Agriculture. 2012 Census of Agriculture 3. Snapshot of Farms and land across the States Source: USDA NASS, 2012 Census of Agriculture. The decline in farms and farmland from 2007 to 2012 Farms Producing Energy was not uniform across the country. The number of farms actually increased in sixteen states, and the amount of In 2012, more than 57,000 farms produced renewable farmland increased in nineteen. The decrease in number of energy for either the farm's direct use or for sale to others, farms is particularly evident in the Southeast and Midwest. more than double the number that did so in 2007.
8 The most The modest decline in farmland is spread fairly evenly widely used systems were solar panels (36,331 farms), fol- across the country. lowed by geoexchange systems, wind turbines, biodiesel, and ethanol. Another 10,000 farms leased the wind rights on the land to others for energy production. The top states Top Ten States in farms producing renewable energy in 2012 were: .. number of farms .. acres of farmland Texas Texas Number of Energy Farms Energy Farms as % of Farms Missouri Montana California 5,845 Hawaii 18%. Iowa Kansas Texas 4,824 Alaska 9%. Oklahoma Nebraska Illinois 3,046 Vermont 9%. California South Dakota Iowa 2,463 California 8%. Kentucky New Mexico Indiana 2,397 Wyoming 7%. Ohio North Dakota Illinois Oklahoma Minnesota Colorado Wisconsin Iowa About the Census of Agriculture = %. The Census of Agriculture is the leading source of facts and figures about American agriculture. USDA's National Agricultur- Irrigated Farmland al Statistics Service (NASS) conducts the census once every five years, and conducted the 2012 Census of Agriculture in In 2012, farmers irrigated 56 million acres, or 6 early 2013 based on 2012 end-of-year data.
9 Percent of all farmland. All states have some irrigated farmland, but irrigation is concentrated geographically and The 2012 Census results are now available, providing informa- tion at National , state, and county levels about what Agricultural by crop. About 80 percent of all land in orchards, berries, products were raised in the United States in 2012, where, how, and vegetables is irrigated. Other crops with more than 25 and by whom. percent of total acres irrigated in 2012 include rice (100. percent), cotton (41 percent), alfalfa hay (35 percent), Census data are available in multiple formats to help all users, peanuts (32 percent), sugar beets (32 percent), dry edible professional and casual, find and use exactly what they need. Available tools include: beans (29 percent), and barley (26 percent). Quick Stats an online database to retrieve Irrigated Acres as Percent of Farmland, by County, 2012 customized tables A new tutorial video easy-to-follow instructions for Quick Stats An API for developers In Quick Stats , click the Developers tab = Desktop Data Query Tool a downloadable desk top tool to analyze data without Internet access Agricultural Atlas pattern and dot maps profiling many aspects of agriculture at the county level Infographics fun, informative snippets of Census data and context percent Highlights more documents like this one <1 summarizing key facts on a topic 1-4 A link to census data is also available on USDA's open data 5-9 portal, 10 - 24.
10 25 - 39. 40 +. 4 USDA is an equal opportunity provider and employer.